139 results
4th grade statistics resources for Microsoft PowerPoint
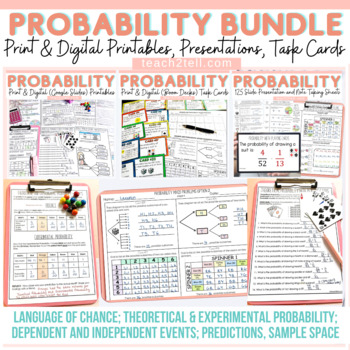
Chance and Probability Activities Theoretical & Experimental Probability Bundle
Are you teaching your students all about chance and probability and looking for fun hands-on probability activities? This print and digital bundle of worksheets, task cards, slideshows and note-taking sheets on Probability will reinforce the understanding of theoretical probability, experimental probability, language of chance, sample space, predictions, lists, tree diagrams, dependent probability events and independent probability events.Both US and British English spelling and terminology file
Subjects:
Grades:
4th - 7th
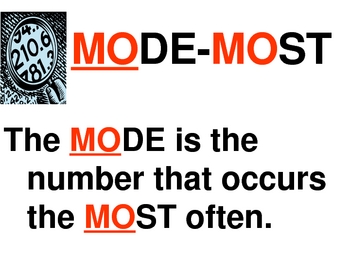
Statistics Mean, Median, Mode & Range Interactive PowerPoint by Erica
Introduce statistics including mean, median, mode and range with this colorful, interactive 22 slide PowerPoint. This interactive PowerPoint introduces each term and teaches a strategy for finding the value. There is also a trick or visual to help students remember the steps to find each one (mean, median, mode and range). Students are able to practice finding the mean, median, mode and range and then check within the PowerPoint. This is excellent for a statistics lesson or for students to e
Subjects:
Grades:
3rd - 6th
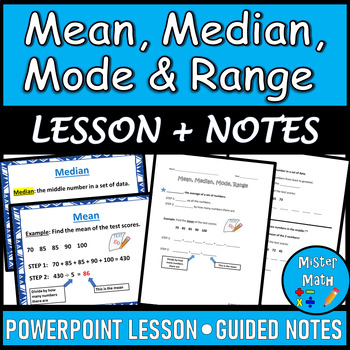
Mean, Median, Mode & Range PPT and Guided Notes BUNDLE
This Mean, Median, Mode & Range BUNDLE includes a PowerPoint Lesson and a corresponding Guided Notes Packet to assist students in learning about finding the mean, median, mode, and range of data sets. The PowerPoint and Guided Notes packet include key vocabulary, as well as an example for each skill. Additional practice problems are included that ask students to find the mean, median, mode and range of four data sets (for a total of 16 extra practice problems!) The presentation also comes fu
Subjects:
Grades:
3rd - 6th
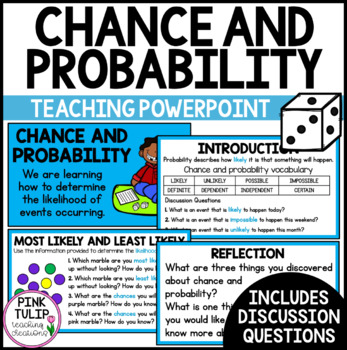
Chance and Probability - Teaching PowerPoint Presentation
Chance and Probability - Teaching PowerPoint PresentationCurriculum aligned PowerPoint presentation to guide explicit teaching of chance and probability, including likelihood. Includes:Learning intention.Introduction (tune in). Engaging graphics.Detailed explanations of various chance events.An in-depth vocabulary of terms such as likelihood, probability, chance, independent, dependent, and impossible.Discussion questions with answers.Reflection slides.Glossary. US spelling and UK spelling vers
Subjects:
Grades:
3rd - 5th
Also included in: Math PowerPoint Presentations Bundle
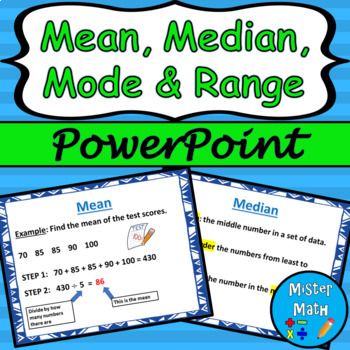
Mean, Median, Mode & Range PowerPoint Lesson
This is a PowerPoint Lesson to assist students in learning about finding the mean, median, mode, and range of data sets. The PowerPoint includes key vocabulary, as well as an example for each skill. Plenty of real-life examples are included to give students ample opportunities to connect the skills to the real world. The presentation also comes fully animated, with animations triggered by mouse click (or presentation pointer!)This PowerPoint lesson is also part of a BUNDLE that includes a guided
Subjects:
Grades:
3rd - 6th
Also included in: Mean, Median, Mode & Range PPT and Guided Notes BUNDLE
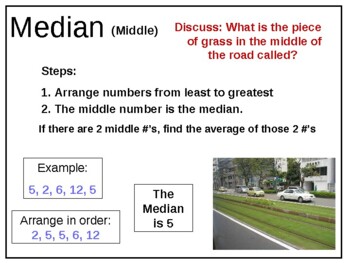
4th 5th 6th Grade Math Mean Median Mode Range MMMR Data Gr 4 5 6 Whole Numbers
This 16-slide Math PowerPoint introduces Mean, Median, Mode and Range and gives hints on how to remember each term. There are numerous practice problems as well. The numbers (data) used may be smaller than you desire, but the numbers are easily changeable and you'll still be able to use the examples. The last slide gives directions for a game to practice Mean, Median, Mode and Range using playing cards.
Subjects:
Grades:
4th - 6th
CCSS:
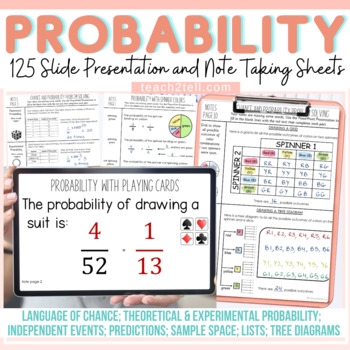
Chance and Probability Activities PowerPoint Presentations and Guided Notes
Are you teaching your students all about chance and probability and looking for fun hands-on probability activities? This Probability resource features 125 animated slides and 32 Cornell-style note-taking sheets to make abstract content on Chance and Probability more concrete.Your students will have a better understanding of theoretical probability, experimental probability, language of chance, sample space, predictions, lists, tree diagrams, and independent probability events.Both US and Britis
Subjects:
Grades:
4th - 8th
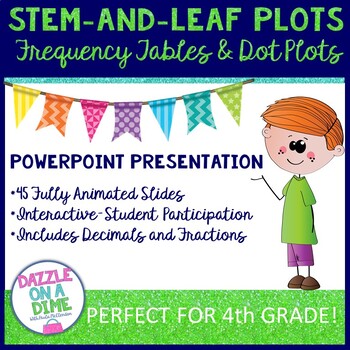
Stem and Leaf
Stem and Leaf Plots: This Stem and Leaf Presentation also includes Frequency Tables and Dot Plots appropriate for 4th grade TEKS Math standards. Stem and Leaf Plots are often very difficult for students to understand. This Stem and Leaf PowerPoint carefully constructs the key concepts for students to understand and develop new understandings. It also shows a visual comparison of Stem-and-Leaf Plots to Frequency Tables and Dot Plots. It contains examples of data using fractions and decimals t
Subjects:
Grades:
4th
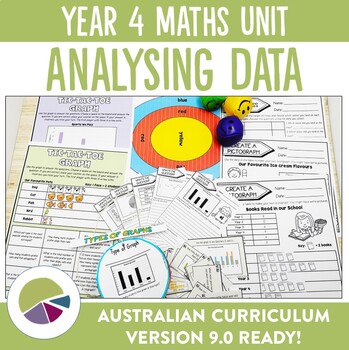
Australian Curriculum 9.0 Year 4 Maths Unit Data
Explore types of data and graphs with this unit plan and activity bundle. Bring your maths lessons to life as the unit plan walks you through everything you need to thoroughly cover the AC9M4ST01, AC9M4ST02 and AC9M4ST03 elements of the Australian Year 4 Maths curriculum (version 9.0). Fun for students, easy for you to implement and an irresistible way for budding mathematicians to learn about statistical data and representation!Bring the fun back into learning about data as you guide your stude
Subjects:
Grades:
3rd - 5th
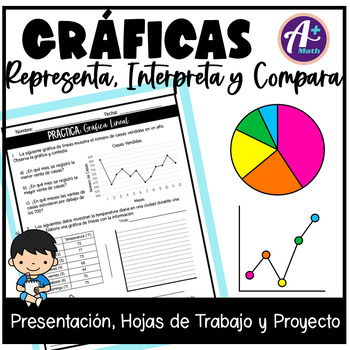
Gráficas - Estadística
Gráficas - Estadística - Analizar DatosEste recurso trabaja los siguientes temas:Gráficas: Representa, Interpreta y Compara•Recopilar y Organizar Datos •Tabla de Frecuencias•Gráfica de Barras•Gráfica Circular•Gráfica Pictórica•Gráfica Lineal•Tabla de Tallo y Hojas•Diagrama de PuntosEl recurso incluye:•Presentación en PowerPoint y PDF - 55 diapositivas con explicaciones y ejemplos•8 hojas de trabajo - Incluye la clave de respuestas•3 hojas de trabajo - Proyecto - Encuesta y analiza los res
Subjects:
Grades:
4th - 6th
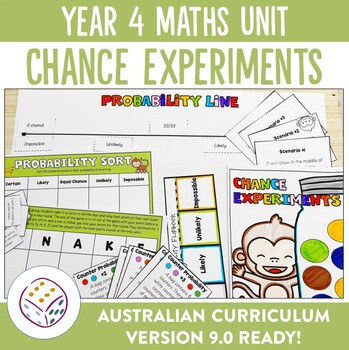
Australian Curriculum 9.0 Year 4 Maths Unit Chance
Explore the concept of chance with this unit plan and activity bundle. Bring your maths lessons to life as the unit plan walks you through everything you need to thoroughly cover the AC9M4P01 and AC9M4P02 elements of the Australian Year 4 Maths curriculum (version 9.0). Fun for students, easy for you to implement and an irresistible way for budding mathematicians to learn about chance experiments and outcomes!Bring the fun back into learning about probability as you guide your students through t
Subjects:
Grades:
3rd - 5th
Also included in: Ultimate Australian Curriculum 9.0 Year 4 Units Bundle
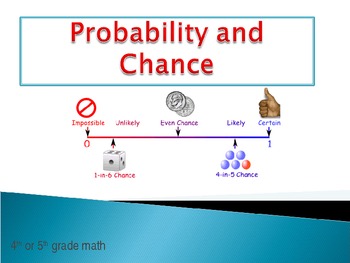
Probability and Chance Powerpoint using candy, dice, spinners and more
Probability and Chance:
This Powerpoint includes definitions, examples, descriptions, and multiple choice questions.
It also includes slides for guided practice using M&Ms.
Subjects:
Grades:
3rd - 6th
Psychology Random Sample Population Stats M&M Worksheet for Research Methods
Psychology or Statistics Random Sample & Population Statistics M&Ms Worksheet Activity for Research Methods includes a teacher direction sheet with materials that you need and how to complete the activity along with printable handout for students. *Student Favored activity*Please email me with any questions at ReadySetLearnSocialScience@yahoo.comIf you would like to get updates on NEW and CURRENT resources...►FOLLOW Me on Teachers Pay Teachers►FOLLOW Me on Pinterest►FOLLOW Me on Instagr
Subjects:
Grades:
4th - 12th, Adult Education
Types:
Statistics, Probability, and Data Slide Show for Grades 3 and 4
The vocabulary and concepts included are sets, data, survey, tally, charts, diagrams, graphs, key, mean, probability, combinations, and tree diagrams.The 49 PowerPoint slides are a combination of teaching (lecture style) and interactive slides (matching, fill-in, multiple choice, etc).Also included is a Directions Page for using PowerPoint and for using the PEN OPTION of PowerPoint.The Preview File is pages 1-11 of the Slide Show so that you can "Try before you Buy".~~~~~~~~~~~~~~~~~~~~~~~~~~~~~
Subjects:
Grades:
3rd - 4th
Also included in: Math for Grades 3-4 PowerPoint Slide Show BUNDLE Math Vocabulary
Ratios- 2 Truths, 1 Lie
This product contains LOTS of options:
- Power Point Presentation with sound effects and answer available on click
- PDF version of the PPT with two copies of each slide- the second containing the answer (in case you don't own the fonts and don't want to purchase them)
- PPT turned into Task Cards (great for centers or SCOOT!)
- Answer Sheet to use with PPT or Task Cards
Skills Covered:
Identify the ratio given a picture, find equivalent ratios, interpret data from a table in order to name a
Subjects:
Grades:
4th - 7th
Fun with Probability Powerpoint Presentation
This fun powerpoint presentation presents and defines probability in clear terms that are easy for students to understand.
Includes three full class practice example questions, and two pair-work practice problems with three questions each.
This item is included in my Fun with Probability Lesson Pack.
Though my district begins probability in 4th grade right now, it is not covered in Common Core until 7th grade. The NCTM standards begin probability in 3rd-5th, so I have listed the grade range a
Subjects:
Grades:
3rd - 7th
Types:
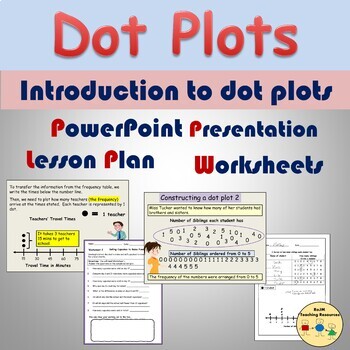
Dot Plots Line Plots Worksheets Presentation Frequency Tables Statistics
This resource relates to statistics on the topic of dot plots. It introduces dot plots on PowerPoint (12 Slides). The presentation demonstrates how the data was collected, rearranging data in numerical order, and presenting the data on a frequency table. Using the information on the frequency table, students are shown how to create a dot plot/line plot via Slide Show animation. Two detailed examples are shown. Content:· PowerPoint Presentation (12 Slides)· 1 Flexible Lesson Plan (1- 2 hrs)· 2 Se
Subjects:
Grades:
3rd - 5th
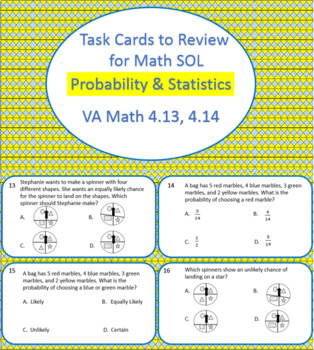
28 Task Cards to Review Probability & Statistics for 4th Grade Math SOL 2016 SOL
28 cards to review the Probability & Statistic questions often seen on the Virginia math SOL. These questions were written with similar sentence stems with the same type of rigor. These are aligned with the 2016 Standards of Learning (SOL). Students can master these concepts with a bit of practice with the testing language. Task cards break up the monotony of test prep by being used in a variety of different ways.You could pass out a few to each student at a time and when they are finished h
Subjects:
Grades:
3rd - 5th
Types:
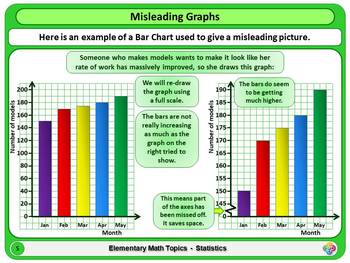
Misleading Graphs for Elementary School Math Powerpoint
A short Powerpoint Presentation to explain misleading graphs.This powerpoint has a title and end slide, as well as the number of slides stated above.You may prefer to purchase this product as part of one of the following two Bundles, which are both available from my shop on this site and offer excellent value:"Elementary School Math Topics: Statistics" (10 powerpoints)"Elementary School Math Topics: The Full Set". (88 Powerpoints)
Subjects:
Grades:
2nd - 5th
Types:
Probability: Direct Instruction - VA SOL 3.14
The product provides 5 days of Direct Instruction for Probability, SOL 3.14. Included is 2 days of animated Google Teaching Slides and 3 days of Nearpod Instructional Slides. The Nearpod links are accessed on Days 3, 4 and 5 of the Google slides by clicking on the Nearpod Logo!Day 1 - Defining Probability, Identifying and Using Probability Terms Day 2 - Defining Probability, Identifying and Using Probability Terms Day 3 - Identifying and Using Probability Terms, Filling in Models to Show Probabi
Subjects:
Grades:
3rd - 4th
Types:
Halloween Math Powerpoint Quiz - FUN CLASS ACTIVITY
A fully animated Halloween maths quiz with sound. Updated 2016.. This is a quiz for teams of children working together solving problems. Order pumpkins by weight; work out how many frogs and spiders are in the cauldron; match the ghostly frames using enlargement; calculate mean, median, mode and range to compare pumpkin patches; and finally go trick or treating using factors, primes and multiples. Click the drop down pumpkin to return to the score sheet. Click the witch to move to next slide.The
Subjects:
Grades:
4th - 7th
Graphing & Probability Jeopardy Review Game
A fun and exciting way for students to review Graphs, Probability, and Combinations/Outcomes. This game is similar to a Jeopardy Game where students will answer the questions to earn points! This game puts a little twist on regular Jeopardy by turning it into what I call "Jailbreak Jeopardy". The students must work to answer the questions before the Math Thief gets away! The team with the most points, puts the Math Thief back in jail and wins the reward! (I usually provide students with a math p
Subjects:
Grades:
2nd - 4th
Also included in: Jailbreak Jeopardy Bundle
Data Slides Bundle
This is a bundle of two slideshows to introduce data concepts to your students (TEKS 4.9/CCSS 4.MD.B). Two skills are included:-Data representations (4.9A and B/4.MD.B.4)-Solving multi-step problems using data (4.9B/4.MD.B.4)This is a great deal for all of TEKS in unit 7/CCSS units on data. PowerPoints and PDFs are also available individually if you'd prefer to purchase each standard separately. This bundle helps you save as it includes both the editable PPT and non-editable PDF versions of all
Subjects:
Grades:
3rd - 5th
CCSS:
Unit 5 – Questions can be asked and answered by collecting and intepreting data
Accompanying slides for the Stage 2 NSW Mathematics unit- Unit 5 – Questions can be asked and answered by collecting and interpreting data.Contains 124 slides with lesson steps and teacher notes.
Subjects:
Grades:
3rd - 4th
Showing 1-24 of 139 results


