5 results
Biology Common Core 8.SP.A.1 resources
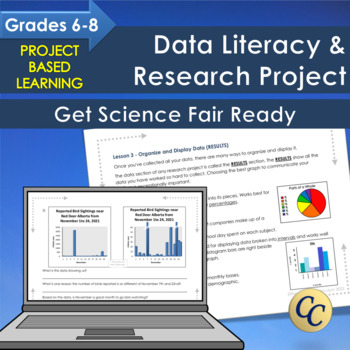
Get Science Fair Ready! Project Based Learning Data Literacy for Middles School
Science fair project that helps you teach data management, statistics and probability. Real data and meaningful science! The data literacy and research project covers everything middle school students need to know about collecting and interpreting data for their own animal observation observation project. Great for science fairs! Learn about collecting objective, non-bias data and how to recognize it in the real world. → Everything is included to have students learn about data, collect data and
Subjects:
Grades:
6th - 8th
NGSS:
MS-LS2-1
Also included in: Canadian Grade 6 Math Bundle | For Print and Easel
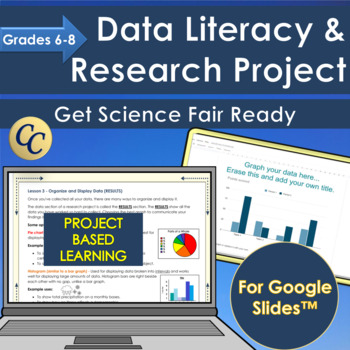
Get Science Fair Ready! Project Based Learning Data Literacy with Google Slides
Science fair project that helps you teach data management. Middle school data literacy and research project covers everything middle school students need to know about collecting and interpreting data for their own animal observation observation project. Great for science fairs! Learn about collecting objective, non-bias data and how to recognize it in the real world.Everything is included to have students learn about data, collect data and present a meaningful research project.Students can pers
Subjects:
Grades:
6th - 8th
Types:
NGSS:
MS-LS2-1
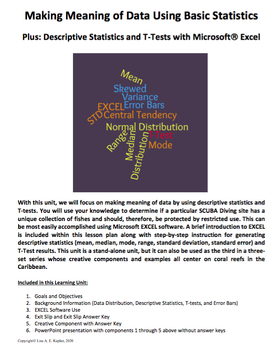
Making Meaning of Data Using Basic Statistics – Plus Statistics with EXCEL
This learning unit includes two files – a PDF document and a PowerPoint presentation. The PDF includes the following components and can be used solely by the teacher or modified to remove the assessment pieces and distributed to the students. 1. Goals and Objectives2. Background Information a. Data Distribution, Descriptive Statistics, T-tests, and Error Barsb. EXCEL Software Use3. Assessmentsa. Exit Slip and Exit Slip Answer Keyb. Creative Component with Answer Key All of the background info
Subjects:
Grades:
7th - 10th
CCSS:
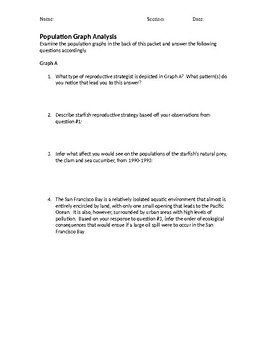
Population Graph Analysis
Students examine graphs showing population fluctuations of two related species in the San Francisco Bay area and answer questions based off of their observations. The activity reviews a plethora of terms and concepts pertaining to Ecology and Biology, such as reproductive strategies, carrying capacity, symbiotic relationships, etc.
Subjects:
Grades:
7th - 12th
Types:
CCSS:
Experimental Variables and Graphing
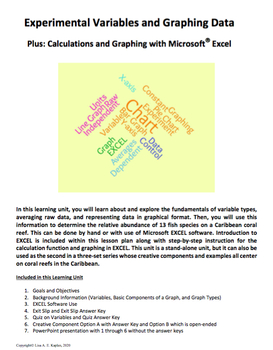
This learning unit includes two files – a PDF document and a PowerPoint presentation. The PDF includes the following components and can be used solely by the teacher or modified to remove the assessment pieces and distributed to the students. 1. Goals and Objectives2. Background Information a. Variables, Components of a Graph, Graph Typesb. EXCEL Software Use3. Assessmentsa. Exit Slip and Exit Slip Answer Keyb. Quiz on Variables and Answer keyc. Creative Component Options A with Answer Key and
Subjects:
Grades:
7th - 9th
CCSS:
Showing 1-5 of 5 results


