4 results
Common Core 6.SP.B.4 lectures

Statistics Unit
Fun with Box and Whiskers, Mean, Median, Mode, Range, Five Number Summary using anything from McDonald's food to M&M's with SKittles.

Statistics (Mean, Median, Mode, Box and Whiskers, with the five number summary
Teaching statistics to 6th graders can be an engaging experience by making the concepts relatable and visual. Five-Number SummaryThe five-number summary includes the minimum, first quartile, median, third quartile, and maximum. These values help summarize a set of data and are used in creating box plots. Start by having students collect a small dataset, such as their test scores, and calculate these five points to see how data is distributed.Box and Whisker PlotsA box and whisker plot (box plot)
Subjects:
Grades:
5th - 7th
Types:
Also included in: Statistics Unit

6th Grade Math Quarter 3 - Coordinate Plane, Geometry
Full quarter of 6th grade level math lessons including integers, the coordinate plane and graphing, geometry including 2D and 3D, circles and spheres

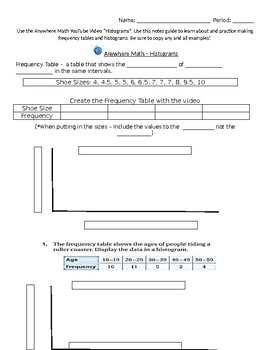
Histograms Youtube Video Notes - Fill in the Blank Anywhere Math
This notes-guide (scaffold notes) is to be used with the Histogram online video tutorial made by Anywhere Math (fantastic channel dedicated to teaching and illustrating various math concepts through the use of examples and simple explanations, we love it!). Anywhere Math videos are free and available on YouTube. The notes guide is fill in the blank so students follow along with instructor and there are screen shots that match the examples the video provides. This episode covers histograms.
Subjects:
Grades:
4th - 7th
Types:
CCSS:
Showing 1-4 of 4 results

