27 results
Free high school statistics research
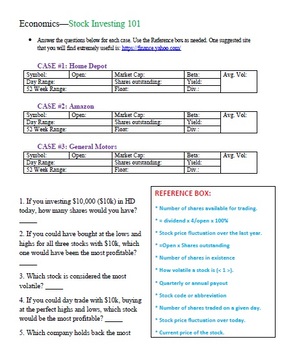
Stock Investing 101
For high school (and savvy middle school) economics students, Stock Investing 101 is a great tool for students to explore stocks on the Stock Market. This worksheet can be easily edited by simply changing the companies that the students need to investigate in order for it to be used over and over again. Estimated time for student completion: 45-60 minutes
Subjects:
Grades:
7th - 12th
Types:
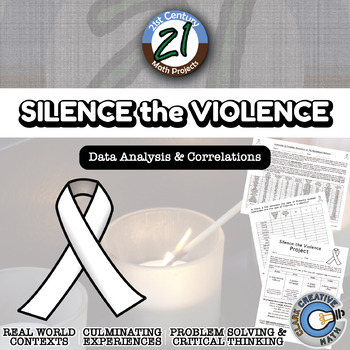
Silence the Violence -- International Data Analysis - 21st Century Math Project
Silence the Violence intends to take a closer look at gun violence throughout the world. Is there a correlation between gun ownership and gun violence? While this is on the news, and people argue back and forth, unfortunately there are not a lot of statistics cited.I built this project through the use of correlations of authentic international data. I have included content for either middle school (plotting and calculating) or high school (calculating correlation with summations). The results ar
Subjects:
Grades:
6th - 12th
Types:
CCSS:
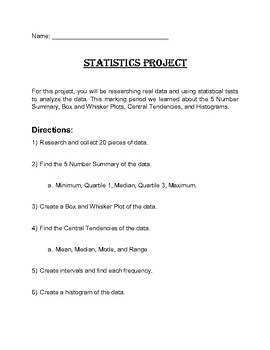
Statistics Project and Gallery Walk: Data, Box Plot, 5 Number Summary, Histogram
Need a summative assessment for your statistics class?This Statistics Project is a great way for students to show their knowledge of gathering and collecting data, calculating 5 Number Summary, creating Box and Whisker Plots, analyzing Central Tendencies, and graphing Histograms. Students can pick their own topic, create a poster of their data, and then present their findings to the class through a Gallery Walk.Example project is included.
Subjects:
Grades:
7th - 10th
Types:
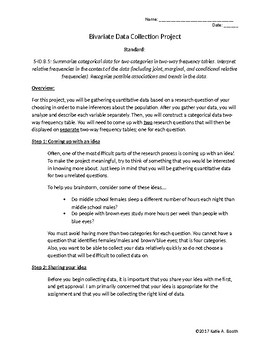
Bivariate Categorical Data Project
This is an Algebra 1 Statistics project I have completed with my students. The final project contained a hand drawn two-way frequency table with the write up and other documents attached to poster paper.
Subjects:
Grades:
8th - 12th
CCSS:
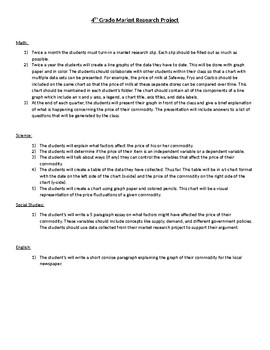
Market Research Project
This is a great project I am currently working on with my 4th grade students. We signed up to research various products that are commonly bought at the supermarket. Some of the items we are researching include spinach, milk, wheat bread, turkey, cheese, and peanut butter. Every other week we collect data by shopping or calling the store. We record the date the information is collected, the quantity of the product (ounces or fluid ounces), and the price of the product. We use this information to
Subjects:
Grades:
4th - 9th, Adult Education
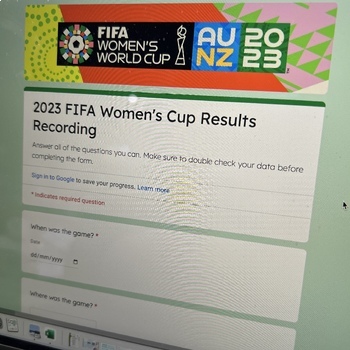
2023 FIFA Women's World Cup Data Recording Google Form
Let's celebrate the FIFA Women's World Cup and engage students in gathering data. This Google Form gathers:- Game results- Attendance at the game/Ticket sales- Goals- Attempted goals- Cards- Why cards were givenUse this data to further Statistical Investigation skills and support rich real-world Maths learning. This is designed to work with the 2023 FIFA Women's World Cup Data Recording Google Form, 2023 FIFA Women's World Cup Data Recording Template and 2023 FIFA Women's World Cup Goal Line Gra
Subjects:
Grades:
2nd - 12th
Types:
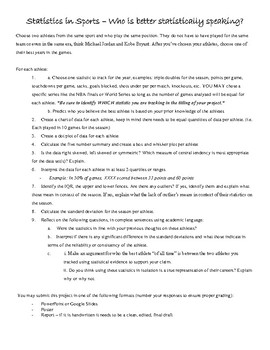
Statistics in Sports - Who is better statistically speaking?
Give students the unique opportunity to explore athletes from any sport, peak their interest, and engage with one variable statistics in a meaningful way. Just create a quick rubric based on your grading practices and let them SOAR!
Suggested to have students claim their athletes or sports events in advance to avoid too many duplicates, especially if students will be presenting their findings.
Subjects:
Grades:
8th - 10th
CCSS:
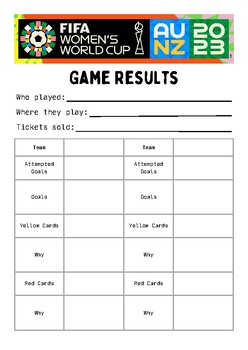
2023 FIFA Women's World Cup Data Recording Template
Let's celebrate the FIFA Women's World Cup and engage students in gathering data. This template gathers:- Game results- Attendance at the game/Ticket sales- Goals- Attempted goals- Cards- Why cards were givenUse this data to further Statistical Investigation skills and support rich real-world Maths learning. This is designed to work with the 2023 FIFA Women's World Cup Data Recording Google Form, 2023 FIFA Women's World Cup Data Recording Template and 2023 FIFA Women's World Cup Goal Line Graph
Subjects:
Grades:
2nd - 12th
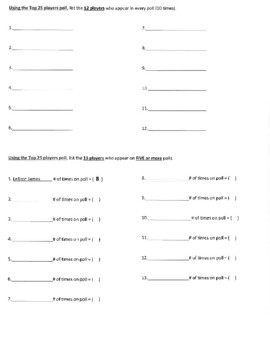
Data Analysis using All-Time NBA Statistics.
According to a new report released by the Education Development Center, Oceans of Data Institute, "the skills necessary for the data analytics jobs of tomorrow aren't being taught in K–12 schools today," said Frank Smith in an article on EdTechMagazine.com.Students will be provided with lists of the All-Time NBA stats leaders from the following categories:1. Points2. Rebounds3. Assists4. Steals5. Blocks6. 3 PT Shots7. Seasons/Games Played8. Most ChampionshipsStudents will also be provided with t
Subjects:
Grades:
4th - 12th
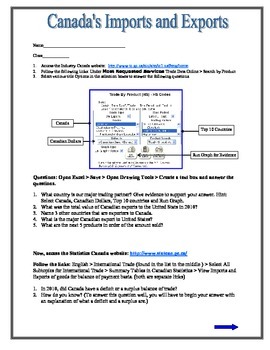
Imports and Exports for Canada
This is an assignment I created many years ago but still useful.
Subjects:
Grades:
6th - 10th

You Be The Researcher (Naturalistic Observation)
Students can learn how to conduct a naturalistic observation with this activity!
Subjects:
Grades:
9th - 12th
Passion-Driven Statistics E-book (Introductory/AP Statistics Course Textbook)
Passion-Driven Statistics is an NSF-funded, multidisciplinary, project-based curriculum that supports students in conducting data-driven research, asking original questions, and communicating methods and results using the language of statistics. The curriculum supports students to work with existing data covering psychology, health, earth science, government, business, education, biology, ecology and more. From existing data, students are able to pose questions of personal interest and then use
Subjects:
Grades:
6th - 12th, Higher Education, Adult Education
Types:
Student Survey
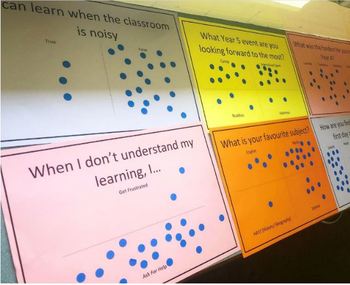
Editable survey posters which allow students to respond anonymously and presents very visual results. Fantastic for students to reflect and an effective tool to inform future teaching.Sized for A3 paper as a editable document. Students will need stickers for responding, one sticker per poster per student. Thank you for downloading! Feel free to tag @incursiveshewrote on Instagram when sharing your posters!
Grades:
4th - 12th
Types:
Units of analysis (data) poster
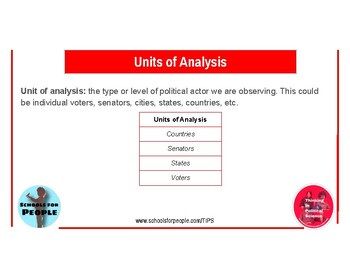
What are the different "levels" of data we look at in the social sciences? Understanding different kinds of data is central to analyzing research in the social sciences. This anchor chart is great for high school and college social science classes like government/economics, psychology, and human geography, as well as research-based classes like AP Seminar or statistics classes.
Subjects:
Grades:
10th - 12th, Higher Education
Types:
CCSS:
Uses of Statistics Essay
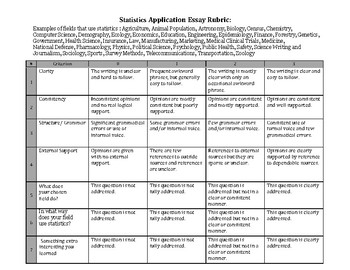
Students often learn statistics without any concept of why certain statistical methods were formulated, and how they are applied in different fields. I use this essay as the introduction to statistics - before anything is taught, so that while they are learning they have prior information to pull from, and a context for studying.I make this a two page paper - the first page explains what the field does, using citation, and the second page writes about how the field uses statistics - also using c
Subjects:
Grades:
10th - 12th
CCSS:
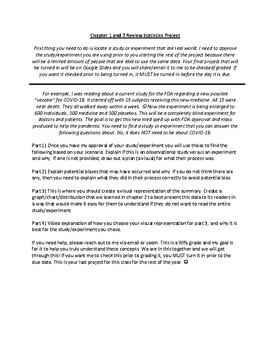
PBL project for Statistics
Project involving studies and experiments mixed with choosing appropriate graphs. Possible bias for surveys and studies.
Subjects:
Grades:
9th - 12th, Higher Education
Types:
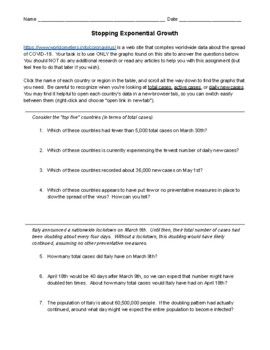
Stopping Exponential Growth || COVID-19 Coronavirus || Distance Learning
This is an online scavenger hunt that asks students to locate and interpret graphs of COVID-19 data in different countries. It involves the basics of exponential growth and requires some exponential calculations. Intended for 8th grade and above.The answer key is accurate as of May 28, 2020.
Subjects:
Grades:
8th - 11th
Types:

Distance Learning Physics Self Paced Home Projects
Contains lesson plans for high school level students in a stay at home or distance learning setting to conduct a major project over the course of 1-2 weeks (60 minutes per day). The projects are self-paced with sufficient instructions without any additional work by the teacher (or parent). Three projects in a variety of STEM areas are included as described below.1. Solar System Exploration Research and Design Project2. Data Visualization Design Project (Tableau)3. Homemade Face Mask DIY Maker P
Subjects:
Grades:
9th - 12th
NGSS:
HS-ESS1-4
, HS-ETS1-2
, HS-ETS1-3
, HS-ETS1-1
, HS-ETS1-4
SPSS software Secondary Data Analysis Workshop (Introductory/AP Statistics)
This handout is intended for those interested in teaching/learning basic introductory statistics concepts to analyze real data. Students will learn how to tell a story using secondary data analysis. The handout is for SPSS and the US Longitudinal Study of Adolescent Health data set. For handouts on the data set code book and raw data file, a PowerPoint to accompany the handout, or questions please email kristin.flaming@gmail.com or ldierker@wesleyan.edu.This handout was developed as a condensed
Subjects:
Grades:
6th - 12th, Higher Education, Adult Education
Types:
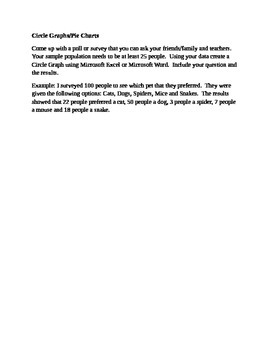
Circle Graphs/Pie Charts
Algebra 1 mini project on Circle Graphs/Pie Charts.
Subjects:
Grades:
6th - 10th, Higher Education, Adult Education, Staff
Types:
Research on Statistics from Countries around the World
This lesson has students research various statistics from countries around the world. Students will gain an understanding how countries differ from each other and how they are the same through statistics.
Grades:
6th - 12th, Adult Education
Types:
Translation Code
As part of our NSF-funded passion-driven statistics project, we have just started to share more widely our “translation code” aimed at supporting folks in learning code-based software and in moving more easily between them. The pdf includes all of the basic syntax for managing, displaying and analyzing data, translated across SAS, R, Python, Stata and SPSS. http://bit.ly/PDSTranslationCode.For more information about our warm and welcoming data-driven curriculum, check out https://passiondrivenst
Grades:
6th - 12th, Higher Education, Adult Education
Types:
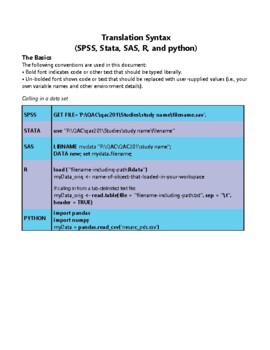
STATA software Secondary Data Analysis
This handout is intended for those interested in teaching/learning basic introductory statistics concepts to analyze real data. Students will learn how to tell a story using secondary data analysis. The handout is for STATA software and the US Longitudinal Study of Adolescent Health data set. For handouts on setting up an account, the data set code book and raw data file, a PowerPoint to accompany the handout, or questions please email kristin.flaming@gmail.com or ldierker@wesleyan.edu.This
Grades:
6th - 12th, Higher Education, Adult Education
Types:

Magic of Touch Book - English
Book reviewing the scientific and professional literature to present evidence on the calming, stress-buffering and life-enhancing effect of touch among animals, among humans, and between animals and humans. High school teachers and college professors will find this text and accompanying lesson plans appropriate for students in environmental studies, philosophy classes, or any specialty class that explores animal behavior.
Subjects:
Grades:
9th - 12th, Higher Education
Types:
Showing 1-24 of 27 results


