814 results
5th grade statistics microsofts
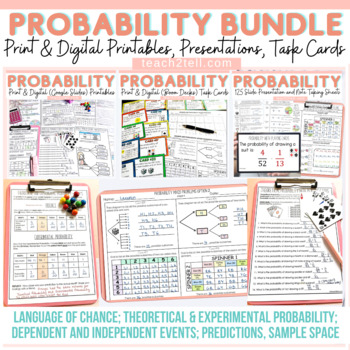
Chance and Probability Activities Theoretical & Experimental Probability Bundle
Are you teaching your students all about chance and probability and looking for fun hands-on probability activities? This print and digital bundle of worksheets, task cards, slideshows and note-taking sheets on Probability will reinforce the understanding of theoretical probability, experimental probability, language of chance, sample space, predictions, lists, tree diagrams, dependent probability events and independent probability events.Both US and British English spelling and terminology file
Subjects:
Grades:
4th - 7th
Statistics Mean, Median, Mode & Range Interactive PowerPoint by Erica
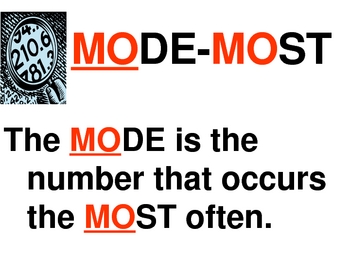
Introduce statistics including mean, median, mode and range with this colorful, interactive 22 slide PowerPoint. This interactive PowerPoint introduces each term and teaches a strategy for finding the value. There is also a trick or visual to help students remember the steps to find each one (mean, median, mode and range). Students are able to practice finding the mean, median, mode and range and then check within the PowerPoint. This is excellent for a statistics lesson or for students to e
Subjects:
Grades:
3rd - 6th
2024 March Mathness Madness NCAA Basketball Probability and Statistics Lesson
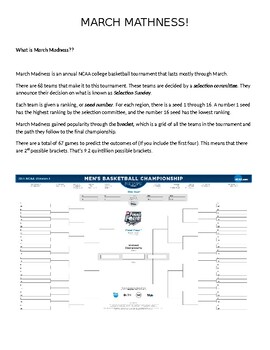
Every year I get my students excited about the NCAA Men's Basketball March Madness Tournament. I see articles written year after year from statisticians, sports journalist, celebrities, etc. about predicting the perfect bracket. Regardless that most have accepted it is nearly impossible, it has not deterred these enthusiast from finding an algorithm or a machine that can predict the outcomes.This packet guides students through 1) An explanation of what March Madness is all about2) A reading abou
Subjects:
Grades:
4th - 12th
Types:
Skittles Chance and Probability (Editable)
Chance and Probability activity using yummy Skittles!!!
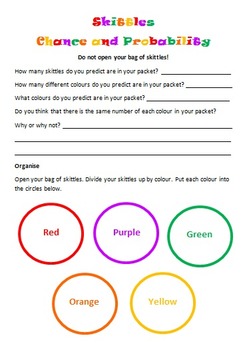
Students are to predict the colours and quantities before they open the skittles bag. Students are to complete a chance experiment where they use a tally to collect their data. Students then transfer their data in fractions, decimals and percentages. Students are to create a bar graph using their data as well as answer chance and probability questions about the data. I used this with my grade 5/6 students and they loved it!
Subjects:
Grades:
3rd - 10th
Types:
Mean, Median, Mode, and Range (Bundled Unit) - Distance Learning
This is an enjoyable, interactive, and engaging bundled unit covering mean, median, mode, and range (and introduces outliers). This unit is great for 5th and 6th graders and 7th graders who struggle with these concepts.Included in this bundled unit:PowerPointAnimated and fun 4-part, 21-slide PowerPoint (multi-day use)-Part 1 – The Meaning of Mean-Part 2 – Getting in the Middle of Median-Part 3 – Making the Most of Mode-Part 4 – Home, Home on the RangeEach section offers plenty of practice probl
Subjects:
Grades:
5th - 7th
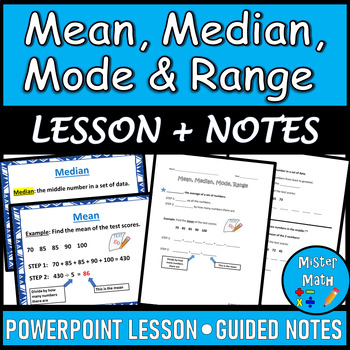
Mean, Median, Mode & Range PPT and Guided Notes BUNDLE
This Mean, Median, Mode & Range BUNDLE includes a PowerPoint Lesson and a corresponding Guided Notes Packet to assist students in learning about finding the mean, median, mode, and range of data sets. The PowerPoint and Guided Notes packet include key vocabulary, as well as an example for each skill. Additional practice problems are included that ask students to find the mean, median, mode and range of four data sets (for a total of 16 extra practice problems!) The presentation also comes fu
Subjects:
Grades:
3rd - 6th
Box and Whisker Plot PPT and Guided Notes 6.SP.2 , 6.SP.4 , 6.SP.5
Box and Whisker Plot
This PPT lesson teaches students the vocabulary that goes with box and whisker plots as well as the steps for creating a box and whisker plot.
Along with the PPT are guided notes where students can answer questions while watching the PPT as well as the answer key. They also have the chance to create their own box and whisker plot. This is a great introductory lesson. This matches Common Core Standards for 6th grade, but could be adapted and used for other grades as we
Subjects:
Grades:
5th - 8th
Geometry: Survey and Circle Graph Project Made Fun!
Circle Graph Geometry Activity - Everyone just wants their piece of the pie!This is a fun, multi-faceted project that will have your students creating and implementing a survey, converting their results using various mathematical operations, and creating a poster-sized circle graph incorporating various geometry skills.This Survey and Circle Graph Project Unit Includes:PowerPoint:-Fun, interactive, 3-part PowerPoint slide presentation that walks you and your students through the entire project f
Subjects:
Grades:
5th - 7th
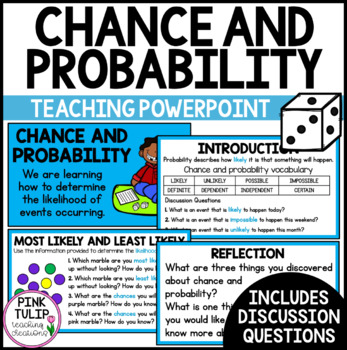
Chance and Probability - Teaching PowerPoint Presentation
Chance and Probability - Teaching PowerPoint PresentationCurriculum aligned PowerPoint presentation to guide explicit teaching of chance and probability, including likelihood. Includes:Learning intention.Introduction (tune in). Engaging graphics.Detailed explanations of various chance events.An in-depth vocabulary of terms such as likelihood, probability, chance, independent, dependent, and impossible.Discussion questions with answers.Reflection slides.Glossary. US spelling and UK spelling vers
Subjects:
Grades:
3rd - 5th
Also included in: Math PowerPoint Presentations Bundle

Candy Probability: Discovery of EXPERIMENTAL vs. THEORETICAL Probability
Middle Schoolers LOVE probability!
This is a GREAT lesson around Halloween when the kids are already hyped up on sugar and want to 'talk' to their classmates.
This activity allows the students to DISCOVER the differences between EXPERIMENTAL and THEORETICAL probability and connect it to everyday experiences. The probability lesson lends itself to fractions, decimals, percents, data collection, rational & irrational numbers, statistical graphs (box and whiskers, frequency tables...), measu
Subjects:
Grades:
5th - 9th
Types:
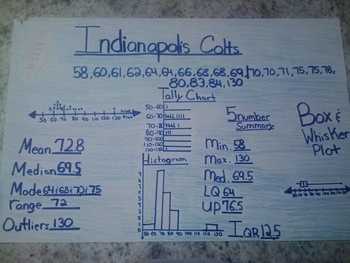
Favorite Sports Team: Data Displays and Measures of Central Tendency Project
Students will create a poster using sports statistics. Depending on the time of year, you may want to use football scores, basketball scores, data from the Olympics, etc. Students will use the internet (or you can print out statistics for them) to find sports data.
The students really buy into this project because it is about something they are interested in - their favorite sports team!
Students will display their knowledge of several data displays: line plot, tally chart, histogram and bo
Subjects:
Grades:
5th - 8th
Types:
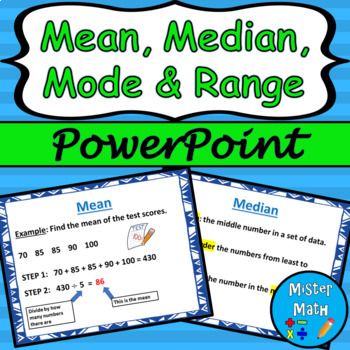
Mean, Median, Mode & Range PowerPoint Lesson
This is a PowerPoint Lesson to assist students in learning about finding the mean, median, mode, and range of data sets. The PowerPoint includes key vocabulary, as well as an example for each skill. Plenty of real-life examples are included to give students ample opportunities to connect the skills to the real world. The presentation also comes fully animated, with animations triggered by mouse click (or presentation pointer!)This PowerPoint lesson is also part of a BUNDLE that includes a guided
Subjects:
Grades:
3rd - 6th
Also included in: Mean, Median, Mode & Range PPT and Guided Notes BUNDLE

Mean, Median, Mode, Range Scavenger Hunt Around the World Escape Room Earth Day
Digital Earth Day Math statistics activity to practice calculating the measure of central tendency including mean, median, mode, and range. This Adventure Math Escape Room is EDITABLE in Google Slides™ or PowerPoint™. Students have to visit all places pinned on the Earth map to find riddles.They have to solve tasks along the way to get the final code. Students must enter this code going to the Earth's core to win.This is a self-checking activity. The recording sheet in Google Sheets™/Excel™ is i
Subjects:
Grades:
5th - 8th
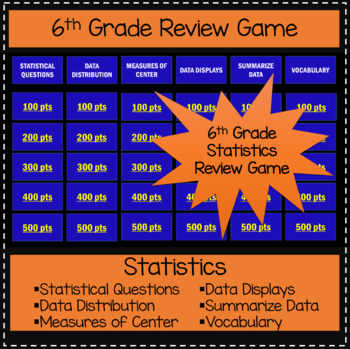
6th Grade Statistics - Game Show Review Game
This is the perfect way to review your 6th grade statistics unit!Students will love this Jeopardy-like game to review the Statistics standards. This game is aligned with Common Core standards. Categories include STATISTICAL QUESTIONS, DATA DISTRIBUTION, MEASURES OF CENTER, DATA DISPLAYS, SUMAMRIZE DATA, AND VOCABULARY. Points range from 100 - 500, which reflect the increase in difficulty from 100-point basic review questions to 500-point questions that require students to apply their knowledge.*
Subjects:
Grades:
5th - 7th
Also included in: 6th Grade Game Show Review Games BUNDLE
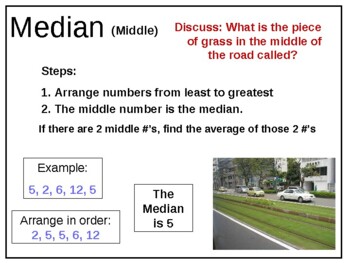
4th 5th 6th Grade Math Mean Median Mode Range MMMR Data Gr 4 5 6 Whole Numbers
This 16-slide Math PowerPoint introduces Mean, Median, Mode and Range and gives hints on how to remember each term. There are numerous practice problems as well. The numbers (data) used may be smaller than you desire, but the numbers are easily changeable and you'll still be able to use the examples. The last slide gives directions for a game to practice Mean, Median, Mode and Range using playing cards.
Subjects:
Grades:
4th - 6th
CCSS:
Mean, Median, Mode, and Range (PowerPoint Only) - Distance Learning
Mean, Median, Mode, and Range - This is an enjoyable, interactive, and engaging PowerPoint covering mean, median, mode, and range (and introduces outliers). This presentation is great for 5th and 6th graders and 7th graders who struggle with these concepts.Included in this Lesson:PowerPointAnimated and fun 4-part, 21-slide PowerPoint (multi-day use)-Part 1 – The Meaning of Mean-Part 2 – Getting in the Middle of Median-Part 3 – Making the Most of Mode-Part 4 – Home, Home on the RangeEach section
Subjects:
Grades:
5th - 7th
Types:
12 Days of Christmas: A Computer Spreadsheet Activity
This great holiday activity shows students how to use a computer spreadsheet to calculate the cost of their true love's gifts in today's dollars.The simple step-by-step procedure will allow both beginning and computer-savvy students to experience success as they learn how to use spreadsheet software. Students will enjoy the engaging and entertaining activity. No computer? No problem! Use the activity master so students can calculate the costs themselves.
Grades:
5th - 9th
Types:
Fraction Line Plots Unit
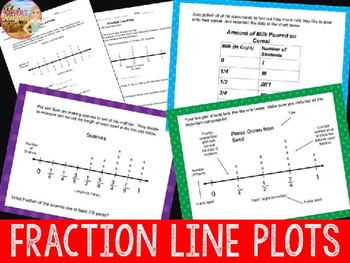
Fraction Line Plots are easy to teach with this unit. Students will interpret line plots with addition and subtraction with these slides and accompanying worksheets.Students will evaluate ready-made fraction line plot data as well as learn how to make their own graphs from a given set of fraction data.Materials Included- Data Analysis Vocabulary Slide- 7 Interpreting Data Graphs (35 slides)- 3 Charts for Creating Graphs (10 slides)- 9 Student Sheets- Post-Test- Answer KeyNo-Prep SetupFor each se
Subjects:
Grades:
5th - 6th
CCSS:
Probability & Statistics in Baseball Project (Common Core Aligned, AND FUN!)
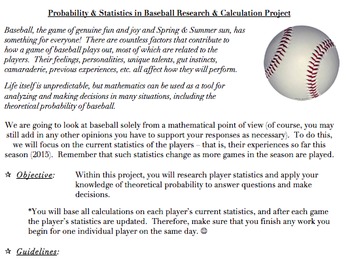
The problems and activities within this document are designed to assist students in achieving the following standards: 6.SP.B.5, 7.SP.C, HSS.CP.A.2, HSS.CP.A.3, HSS.CP.B.7, HSS.CP.B.9, as well as the standards for mathematics practice and the literacy standards. They are also designed to help the teacher assess the students’ abilities when it comes to working with the ideas within the standards.This document contains the following:A project designed to allow students to investigate theoretical
Subjects:
Grades:
5th - 12th, Higher Education, Adult Education, Staff
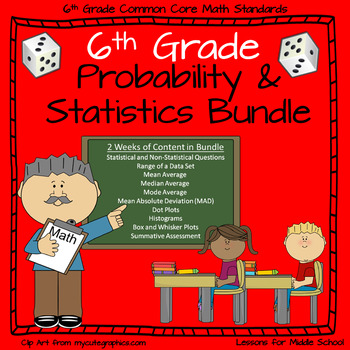
6th Grade Math -Probability and Statistics Bundle
6th Grade Math – Probability and Statistics Bundle - 9 LessonsThis COMPREHENSIVE bundle covers all of the 6th Grade Common Core Math Standards. This is a comprehensive unit so the teacher will only have to download the product and then print out copies with their students. This bundle is part of our 6th Grade Yearlong Math Curriculum. ABSOLUTELY NO PREP REQUIRED, just download and start teaching in minutes. Our preview product is an example of how each individual lesson in the unit is struct
Subjects:
Grades:
5th - 7th
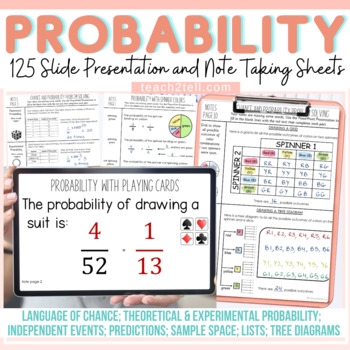
Chance and Probability Activities PowerPoint Presentations and Guided Notes
Are you teaching your students all about chance and probability and looking for fun hands-on probability activities? This Probability resource features 125 animated slides and 32 Cornell-style note-taking sheets to make abstract content on Chance and Probability more concrete.Your students will have a better understanding of theoretical probability, experimental probability, language of chance, sample space, predictions, lists, tree diagrams, and independent probability events.Both US and Britis
Subjects:
Grades:
4th - 8th
Create a Line Plot Project
Looking to assess line plots? Look no further!This project incorporates learning targets, skills, collaboration, and technology.Directions: With a partner, create a question used to collect data from your classmates. (Examples: In inches, how long is your hand? In cm, what is the circumference of your head? etc.) Then, create a line plot with your results. Use fraction intervals.Requirements:Create a reasonable question (Teacher approval required)Collect at least 20 pieces of dataCreate a line p
Subjects:
Grades:
4th - 6th
Types:
CCSS:
Also included in: Upper Grade Math Projects
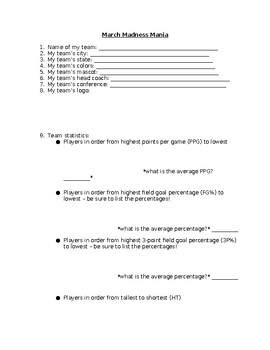
NCAA March Madness Basketball Tournament Team Research Statistics
Do you have students interested in the March Madness basketball tournament? Then this is the activity you need!To begin our March Madness unit, we look at all of the teams participating in the tournament and complete a map together to show where each team is from. We notice that some states have more than others and some states have none, and spend time discussing why that might be. Students will complete their own March Madness bracket.Students will then select a team in the NCAA March Madness
Grades:
4th - 9th
Types:
Mean Median Mode Range with Outliers
This PowerPoint Presentation was made for my Pre-Algebra class, but can easily be adapted for lower grades. The lesson teaches students how to solve for mean, median, mode and range along with how to identify outliers within a set of data (as well as their effects on a data set). Through analytical thinking, students can decipher how to find the measure of central tendency (which average best describes the data set).
This presentation has 50 slides with lots of examples and practice problems.
Subjects:
Grades:
5th - 7th
Showing 1-24 of 814 results


