85 results
Statistics graphic organizer microsofts
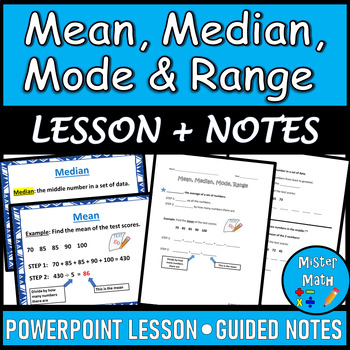
Mean, Median, Mode & Range PPT and Guided Notes BUNDLE
This Mean, Median, Mode & Range BUNDLE includes a PowerPoint Lesson and a corresponding Guided Notes Packet to assist students in learning about finding the mean, median, mode, and range of data sets. The PowerPoint and Guided Notes packet include key vocabulary, as well as an example for each skill. Additional practice problems are included that ask students to find the mean, median, mode and range of four data sets (for a total of 16 extra practice problems!) The presentation also comes fu
Subjects:
Grades:
3rd - 6th
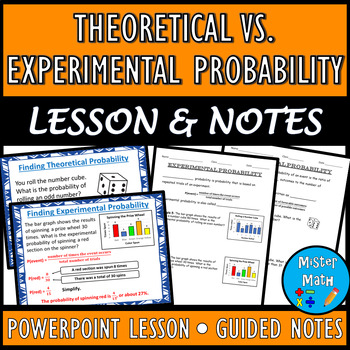
Theoretical vs. Experimental Probability PPT & Guided Notes BUNDLE
This BUNDLE includes a PowerPoint Lesson and a corresponding Guided Notes Packet to assist students in learning about theoretical and experimental probability. Students will learn the concepts of theoretical and experimental probability, as well as how to find the probabilities of each. Plenty of real-life examples are included to give students ample opportunities to practice the skills. Overall, the 21-slide PowerPoint and 6-page guided notes packet covers the following topics:Theoretical Proba
Subjects:
Grades:
6th - 9th
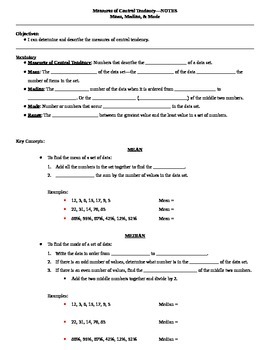
Measures of Central Tendency Guided Notes
These are guided notes for a lesson on measures of central tendency including mean, median, mode, and range. There are several examples in the notes and the same data sets are used to show each measure of central tendency.I have also included a teacher key to show you what to fill in the blanks as your students follow along.To use these notes, I simply projected them onto my whiteboard, gave the students their blank copies, and had them follow along and write what I wrote. This works great when
Subjects:
Grades:
5th - 12th
CCSS:
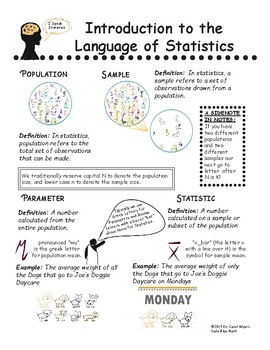
Introduction to the Language of Statistics - SketchNotes and Lecture Slides
This is a guided lecture that covers the basic vocabulary of Statistics, including Population, Statistic, Types of Data, Types of Sampling and Types of Studies. The lecture notes use simple pictures, icons and examples to help students visualize the language. The lesson includes: Teacher Notes4-pages of SketchNotes completely filled in4-pages of SketchNotes with blanks for students to fill inA 10 question (1 page) Knowledge Check for formative assessmentThe answer key for the Knowledge CheckA
Subjects:
Grades:
10th - 12th, Higher Education
CCSS:
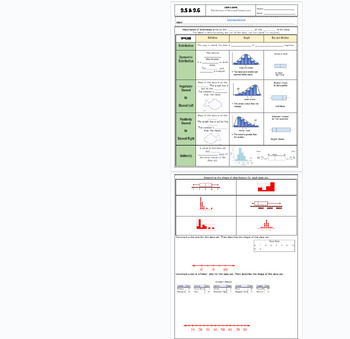
Data Distribution positive/negative skewed fillable notes UPDATED
Unit 9: Data and Stats: Updated(No 9.3/ Skip)9.5/9.6 Data Distribution (skewness)Students go over the vocabulary and complete the examples with the vocabulary scaffolded. Skewness is explained and how to identify it comparing data charts and box and whisker plots. Uses many visuals and examples to differentiate between that different graphs. Notes are scaffolded. Includes hook video hyperlinked on the "learning objective" title. Key is included and hyperlinked as a PDF in the heading highlighted
Subjects:
Grades:
6th - 12th, Higher Education, Adult Education
CCSS:
Also included in: Unit 9: Data and Statistics Fillable Notes
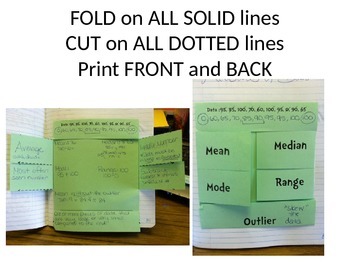
Mean, Median, Mode, Range, Outlier FOLDABLE
This is a download for a one page cut only foldable. Directions are simple, CUT on all dotted lines, FOLD on all solid lines. Gives you 6 flaps to write under with vocabulary on top.
Also includes one set of data to find the mean, median, mode and range (answers included).
This is downloaded in powerpoint, so it can be changed if you do not need the "oulier" topic.
Also, this is an EVEN number of data, so the median will have to be found between 2 numbers: 85 and 90.
This involves deci
Subjects:
Grades:
6th - 8th
Types:
Standard Deviation Fillable Notes UPDATED
Unit 9: Data and Stats: Updated(No 9.3/ Skip)9.4 B Standard DeviationStudents go over the vocabulary and complete the examples with the vocabulary scaffolded. Standard deviation is long hand calculated by showing each step of the process (difference of squares). Real-world examples are explained in notes before calculating to show the importance of this stat and why it is used so often to verify valuable and effective data. Notes are scaffolded. Includes hook video hyperlinked on the "learning o
Subjects:
Grades:
7th - 12th, Higher Education, Adult Education
CCSS:
Also included in: Unit 9: Data and Statistics Fillable Notes
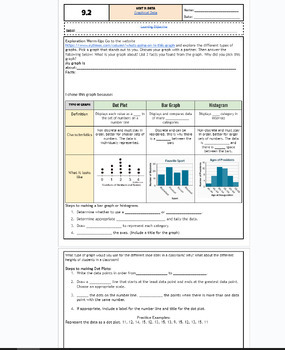
Graphical Data: Bar Charts, Dot Plots and Histograms fillable notes UPDTD
Unit 9: Data and Stats: UpdatedUpdated9.2 Graphs: bar, dot plot, histpgramStudents go over the vocabulary and define each type fo graph and what data fits for each graph. The warm up is an exploratory activity where students go on a website to search for their graph of interest and discuss the key findings. This takes around 10-15 mins and students enjoyed it! Notes are scaffolded. Includes hook video hyperlinked on the "learning objective" title. Key is included and hyperlinked as a PDF in the
Subjects:
Grades:
6th - 12th, Higher Education, Adult Education
CCSS:
Also included in: Unit 9: Data and Statistics Fillable Notes
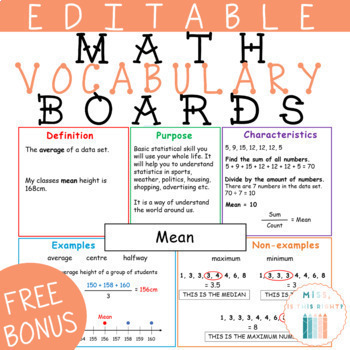
What is Mean Median Mode and Range? - Frayer Model
What is mean, median, mode and range? These Math Vocabulary Boards will give you the answer through definitions of mean, median, mode, range, as well as help students to understand the purpose, characteristics, examples and non-examples. Mean, median, mode and range worksheets are the perfect visual tool for whole-class learning, small groups, individual activities and as a classroom display. They enhance learning for EAL/ESL and SEN students. In this product, you will receive the four words (me
Subjects:
Grades:
6th - 8th
Sampling Methods Graphic Organizer and Practice - AP Statistics, Prob & Stats
This completely editable word document contains everything you need to introduce and practice the different types of Sampling Methods required in the College Board CED for the AP Statistics Course. The first portion of this download is a graphic organizer where students notate on top of a visual of the sampling method, define the sampling method, and then critique the sampling method. The next two pages contain practice where students start by identifying the sampling method used, and then fini
Subjects:
Grades:
10th - 12th
CCSS:
Stock Market Challenge Information Sheet
This document provides students a place to record the information they have gathered from their Stock Market research. It includes a place for students to record their stocks' 52-week high and low, dividends paid, does the company produce goods or provide services, as well as the reasoning as to why your student chose to purchase that particular stock. There are enough recording sheets for 5 stocks. This is a great way to teach students how to record and organize information for later use. If
Subjects:
Grades:
4th - 7th
Types:

Key Performance Data Dashboards Bundle
Bundle includes presentation slides, printable graphic organizer for written practice, virtual graphic organizer for online practice, final project template and rubric.Student assignments are in three parts:Part 1: Print out KPI graphic organizer on 11x17 for students to draw sample charts showcased on presentation slides.Part 2: Virtual graphic organizer practice on Canva.Part 3: Final KPI Dashboard project Canva template.
Subjects:
Grades:
8th - 12th, Higher Education, Adult Education
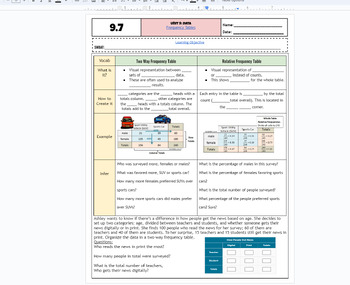
Frequency Tables & Relative Frequency Tables fillable notes UPDATED
Unit 9: Data and Stats: Updated(No 9.3/ Skip)9.7 Frequency Tables Students go over the vocabulary and complete the examples with the vocabulary scaffolded. Students examine a categorical table/frequency table and also use that information to create relative frequency tables. Different real-world examples and problems are used. Emphasized how percents and decimals are calculated. Notes are scaffolded. Includes hook video hyperlinked on the "learning objective" title. Key is included and hyperli
Subjects:
Grades:
6th - 12th, Higher Education, Adult Education
CCSS:
Also included in: Unit 9: Data and Statistics Fillable Notes
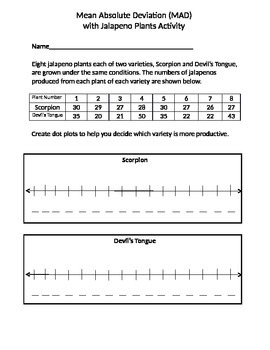
Mean Absolute Deviation Activities involving Jalapenos & Dice
Two Hands-On MAD activities are included: one involving jalapeno pepper plants and the other rolls of a die. Each activity guides students through the process of calculating and understanding MAD using graphic organizers to determine means, create dot plots, calculate Mean Absolute Deviation, and then analyze the data with a thought provoking open ended question for the jalapeno activity. Directions and accompanying graphic organizer guides the student step by step.
Subjects:
Grades:
6th - 7th
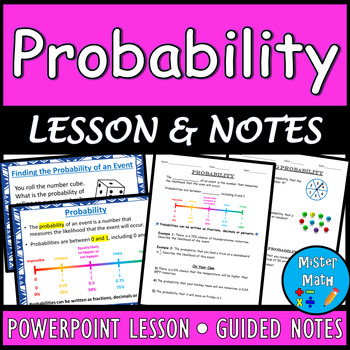
Probability PPT & Guided Notes BUNDLE
This BUNDLE includes a PowerPoint Lesson and a corresponding Guided Notes Packet to assist students in learning about probability. Students will learn the concept of probability and likelihood, as well as how to find the probabilities of events.The PowerPoint and Guided Notes packet include key vocabulary and definitions involving probability, the concept of likelihood, the steps to finding the probability of an event, and how to use probability to answer questions. Plenty of real-life examples
Subjects:
Grades:
6th - 9th
AP Statistics Describing Distributions Graphic Organizers (SOCS and FUDS)
This download contains two graphic organizers to help students describe distributions. The first covers SOCS (or SOCV), which can be used to describe the distribution of one variable. Students can use the graphic organizer to summarize the main ideas behind Shape, Outliers, Center, and Spread (or Variability). The second covers FUDS (or DUFS, etc.) that can be used to describe the relationship between two variables. Students use the graphic organizer to summarize the main ideas behind Strength,
Subjects:
Grades:
9th - 12th
Types:
CCSS:
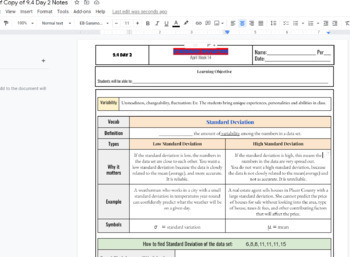
Standard Deviation Scaffolded Fillable Notes AND key
Standard Deviation Scaffolded Fillable Notes AND key, give definitions to the terms with real-world examples! Includes a video link in the notes as the intro to the lesson by describing the meaning and need for standard deviation in the simplest form possible! The key is linked at the top of notes as well that will download as a pdf- not a google doc- did not do the last problem on the bottom as it was an exit ticket for students (no layout).
Subjects:
Grades:
7th - 12th, Higher Education, Adult Education
CCSS:
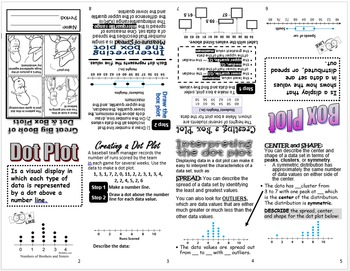
8 Page Mini Book Dot Plots and Box Plots
Use this 8 page mini book for dot and box plots intro. This can be used for 6th and 7th grade Texas TEKS. 7.12 and 6.12A
Subjects:
Grades:
6th - 7th
Types:
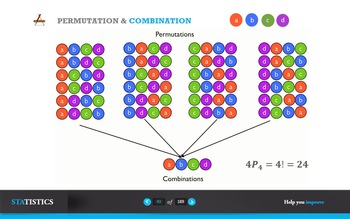
Permutation and Combination
• understand the terms permutation and combination, and solve simple problems involving selections;
• solve problems about arrangements of objects in a line, including
those involving:
• repetition (e.g. the number of ways of arranging the letters of the
word ‘NEEDLESS’),
• restriction (e.g. the number of ways several people can stand in
a line if 2 particular people must — or must not — stand next to
each other).
Subjects:
Grades:
10th - 12th, Higher Education, Staff
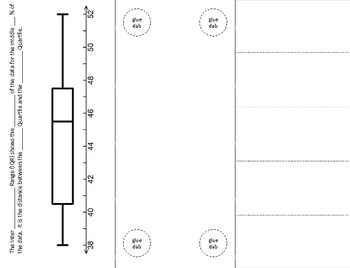
Creating a Box Plot Foldable
TEKS
represent numeric data graphically, including dot plots, stem-and-leaf plots, histograms, and box plots.[6.12A]
interpret numeric data summarized in dot plots, stem-and-leaf plots, histograms, and box plots.[6.13A]
Subjects:
Grades:
6th - 8th
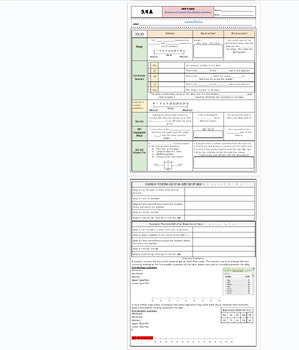
5 Number Summary and Box and Whisker Plots Fillable Notes UPDATED
Unit 9: Data and Stats: Updated(No 9.3/ Skip)9.4 A 5-number summary and box and whisker plot Students go over the vocabulary ad complete the examples with the vocabulary scaffolded. for each statistic with an explanation of the purpose of the 5 number summary and why these are used. Notes are scaffolded. Includes hook video hyperlinked on the "learning objective" title. Key is included and hyperlinked as a PDF in the heading highlighted in the orange box, and at the bottom of the google doc as w
Subjects:
Grades:
6th - 12th, Higher Education, Adult Education
CCSS:
Also included in: Unit 9: Data and Statistics Fillable Notes
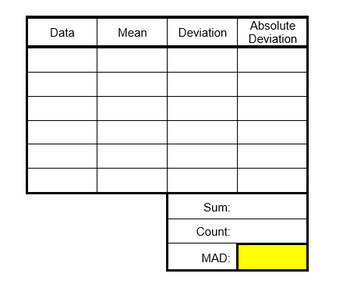
Mean Absolute Deviation Tables
These tables are to guide students through the steps of solving Mean Absolute Deviation problems. They can be used for initial note-taking, guided practice or long term support. There are 6 on a page but they are in a MS Word format so can be edited as needed. Each currently has space for 6 data points to make them seem less overwhelming but it is easy enough to insert/delete rows and make them exactly what you need. If you have any questions about editing it, please let me know and I'll be happ
Subjects:
Grades:
6th - 8th
CCSS:
One Variable Data AP Statistics Unit 1 Slides and Guided Notes
AP Statistics UNIT 1 Guided notes and slides to help your AP Statistics students master the concepts for Unit 1 Exploring One and Two Variable Data.Note: If you have purchased AP STATISTICS Full Curriculum or Unit 1 AP Statistics, you already have these resources. You do NOT need to purchase this.There are 7 slide presentations and accompanying guided notes. All of the resources are 100% editable, to modify to fit your classroom needs. The zip folder includes the Word document, which you have pe
Subjects:
Grades:
9th - 12th
CCSS:
Confidence Intervals slides Notes
Check out this set of statistical inference stations- your students will love learning about point of estimate, margin of error and more exhibition style! Students can travel from station to station - OR- you can print smaller versions and have the students use the cards as independent centers - OR- you can display the powerpoint slides at individual stations. Student response sheet helps guides students through their learning. Best of all they are learning on their own, and you can skip the l
Subjects:
Grades:
9th - 12th
CCSS:
Showing 1-24 of 85 results


