397 results
Statistics graphic organizer pdfs
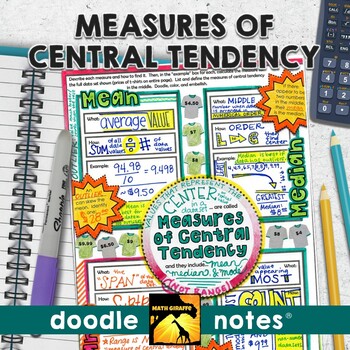
Measures of Central Tendency Doodle Notes (Mean, Median, Mode, & Range)
Mean, Median, Mode, and Range (Measures of Central Tendency): "doodle notes" - visual note taking pages with interactive tasks for building stronger retention of measures of center (mean, median, mode, and range) for your middle school statistics unit in Pre-AlgebraBoost your students' focus and memory! The blend of graphic and linguistic input in these guided visual notes helps students' brains to convert the information to long-term memory more easily.When students color or doodle in math clas
Subjects:
Grades:
6th - 8th
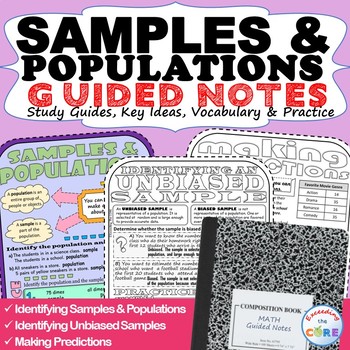
SAMPLES & POPULATIONS Doodle Math - Interactive Notebooks (Guided Notes)
- Great for online learning and distance learning!Have your students use these SAMPLES & POPULATIONS Guided Notes to review key ideas and essential vocabulary . Guided Notes aid in student focus, concept retention, engagement and creativity. Using this resource will allow students to synthesize this math concept and create their own tangible connections in their notes. Guided Notes Includes:__ Key Ideas with Verbal & Numerical Examples__ Essential Vocabulary with Definitions__ Skills Pr
Subjects:
Grades:
6th - 8th
Also included in: 7th GRADE MATH Assessments, Warm-Ups, Task Cards, Worksheets BUNDLE
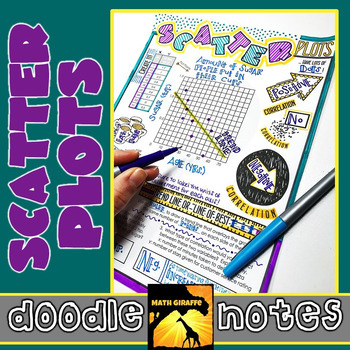
Scatter Plots Doodle Notes
Creating & Analyzing Scatter Plots - Visual Interactive "Doodle Notes"
When students color or doodle in math class, it activates both hemispheres of the brain at the same time. There are proven benefits of this cross-lateral brain activity:
- new learning
- relaxation (less math anxiety)
- visual connections
- better memory & retention of the content!
Students fill in the sheets, answer the questions, and color, doodle or embellish. Then, they can use it as a study guide later on.
C
Subjects:
Grades:
7th - 8th
CCSS:
Box and Whisker Plots Doodle Notes
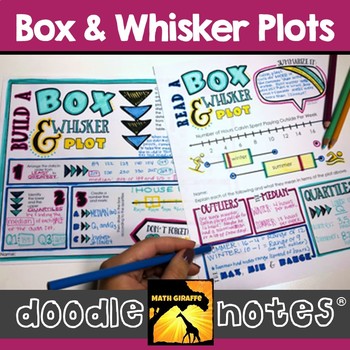
reading and creating box & whisker plots: visual interactive "doodle note" setWhen students color or doodle in math class, it activates both hemispheres of the brain at the same time. There are proven benefits of this cross-lateral brain activity:- new learning- relaxation (less math anxiety)- visual connections- better memory & retention of the content!Students fill in the sheets, answer the questions, and color, doodle or embellish. Then, they can use it as a study guide later on. G
Subjects:
Grades:
6th - 8th
Data Analysis and Statistics Posters and Interactive Notebook INB Set
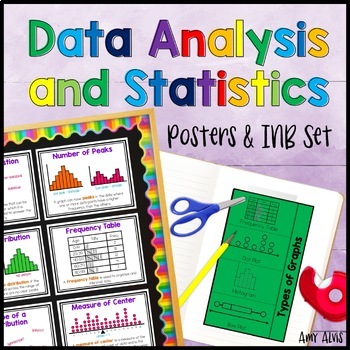
This poster (anchor chart) and interactive notebook (INB) set covers statistical questions, numerical data, categorical data, frequency table, dot plot, histogram, box and whisker plot, box plot, parts of a box and whisker plot, parts or a box plot, measure of center, spread, shape of distribution, symmetry, number of peaks, skewness, uniform distribution, outlier and gaps. The INB pages cover Types of Graphs, Statistical Questions and Patterns in Data.It includes 3 different interactive foldabl
Subjects:
Grades:
6th - 8th
Also included in: 6th Grade Posters and Interactive Notebook INB BUNDLE Anchor Chart
Measures of Central Tendency FUN Notes Doodle Pages
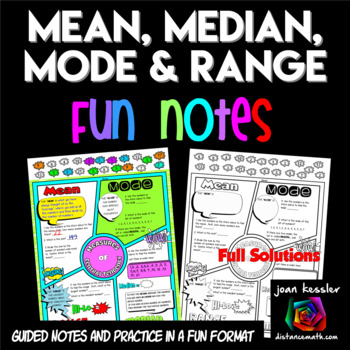
Your students will love learning the Measures of Central Tendency with these Fun Notes done in a comic book theme. Topics include Mean, Median, Mode, and Range. Students complete 6 problems plus definitions. There are two versions of the notes so you can differentiate. The PDF also includes 2 sizes, one standard 81/2 x 11" and the other in half size for INB's. Students love to doodle while learning and it has been shown that doodling and working with fun themed activities help students engage
Subjects:
Grades:
6th - 9th
Also included in: Algebra 1 FUN Notes Doodle Page Bundle
Mean, Median, Mode, and Range Wheel Foldable (Center of Distributions)
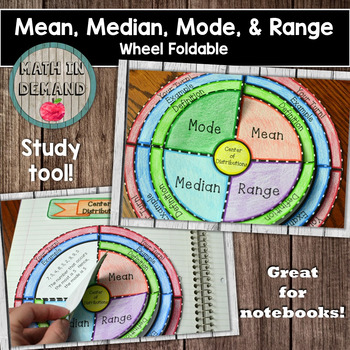
Students will construct a foldable on mean, median, mode, and range. There are 4 layers for the foldable: (1) Title, (2) Definition, (3) Example, and (4) Your Turn!. There is also a blank template included.
CLICK HERE to see my math foldables bundle!
CLICK HERE TO CHECK OUT MY VIDEO ON THIS FOLDABLE!
Subjects:
Grades:
5th - 9th
Also included in: Math Foldables Bundle (Includes All Math Wheel Foldables)
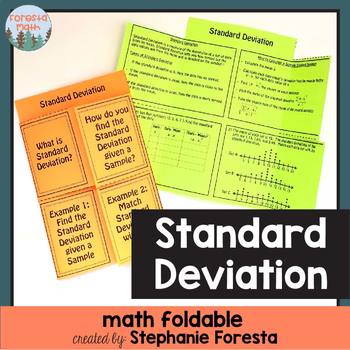
Standard Deviation Foldable
A fun foldable to teach or review finding the standard deviation of a sample. The foldable defines standard deviations, lists the steps to find standard deviation, and has two examples. The first example is a small sample that you can teach students how to find the standard deviation by hand. The second example has 3 standard deviations that must be matched with 3 dot plots by understanding the meaning of small and large standard deviations.
Subjects:
Grades:
7th - 10th
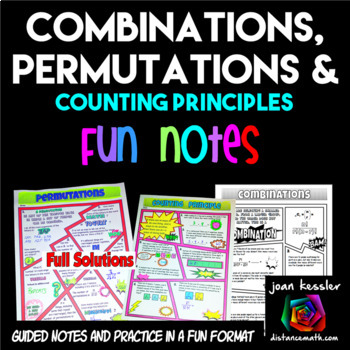
Permutations Combinations and Counting Principle FUN Notes Doodle Pages
Your students will love this Permutations, Combinations, and Counting Principle Fun Notes and Practice resource. Use it in class or as homework, assessment, or enrichment. A fun and engaging format for your students to learn the rules and practice their skills! Great for Algebra and Statistics.This resource contains 3 pages, one each for Permutations, Combinations, and the Fundamental Counting Principle. Students will complete a definitions and formula sections and complete over 20 problems.
Subjects:
Grades:
10th - 12th
CCSS:
Also included in: Algebra 2 FUN Notes Doodle Pages and Practice Bundle
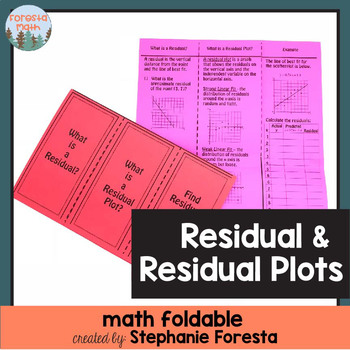
Residual & Residual Plots Foldable
A fun foldable to review or teach residuals and residual plots.
Subjects:
Grades:
7th - 10th
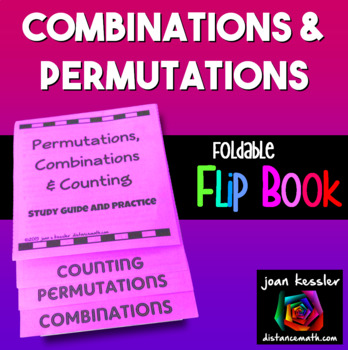
Permutations and Combinations Foldable Flip Book
This Flip Book includes guided notes and practice on Combinations, Permutations, and the Counting Principles.There are 19 problems for students to complete including a challenge problem on the back which is great for differentiation and early finishers. This makes a great study guide.The Flip Book is a perfect size for traditional or Interactive Notebooks, or just to use for studying for a test. Final size 4¼″ x 6½″. This is easy to make, no glue, no mess. Print one page double-sided, make one
Subjects:
Grades:
8th - 11th
CCSS:
Also included in: Algebra 1 Activity Bundle

Hypothesis Tests Introduction Statistics
My Statistics students always had trouble setting up the Null Hypothesis and the Alternative Hypothesis, and without understanding this, the tests and interpretations cannot be determined properly. Now I explain the unit and what Hypothesis Testing is all about first, and start them off with this set of notes and problems. At first they are excited not to do any math or calculations, but then the challenge begins.There are two sets of the problems, one multiple choice and the other mostly free
Subjects:
Grades:
9th - 12th
CCSS:
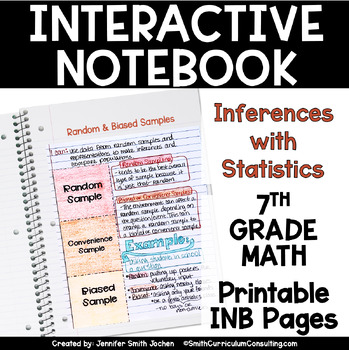
7th Grade Math Inferences & Statistics Interactive Notebook Unit TEKS PRINTABLE
Inferences with Statistics is an extensive unit to allow students to further their understanding of data and understanding how to decipher the statistics that follow along. Breaking down how to interpret the data and analyze it to allow it to be discerned is an important lesson as they continue through their math career. This Inferences with Statistics unit contains 10 unique lessons that have been tried and tested since 2012 inside and outside my own personal classroom. The interactive and kine
Subjects:
Grades:
7th
Also included in: Middle School Math Interactive Notebook Bundle - 6th 7th 8th TEKS CCSS
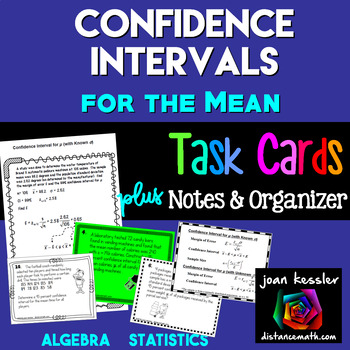
Confidence Intervals for the Mean
Your students will grasp Confidence Intervals for the Mean with this resource which includes Guided Notes, Task Cards, and a Graphic Organizer.What's Included?18 Task Cards for students to practice constructing confidence interval for the mean using the z - distribution and the t - distribution.Cards # 1 - 8 find Confidence intervals given statisticCards # 9 - 10 find Confidence intervals given dataCards # 11 - 12 find sample sizeCards # 13 - 15 find the margin of errorCards # 16 - 18 Given
Subjects:
Grades:
9th - 12th
CCSS:
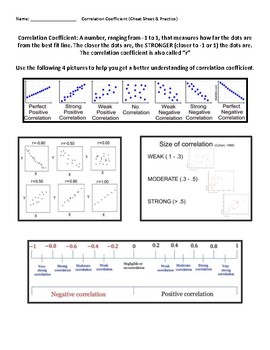
Correlation Coefficient (Cheat Sheet & Notes)
This resource can be used as a self-directed worksheets where students use the cheat sheet to access the 8 practice problems. I typically use this as an extention for 8th graders during the scatter plots unit, or for 9th graders. An answer key is provided. Enjoy!
Subjects:
Grades:
8th
CCSS:
Also included in: Scatterplots Bundle (Weeks of Products!)
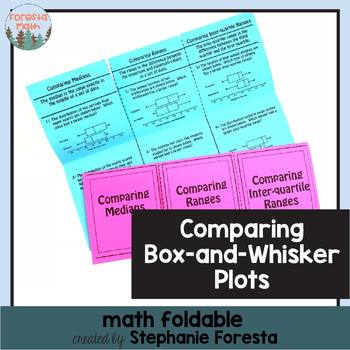
Comparing Box-and-Whisker Plots Math Foldables
A fun foldable to teach or review comparing medians, ranges, and inter-quartile ranges of two box-and-whisker plots.
Subjects:
Grades:
5th - 10th
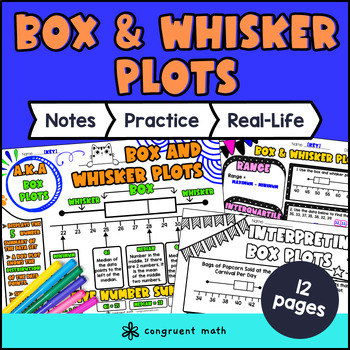
Box and Whisker Plots Guided Notes w/ Doodles | Data & Statistics | Sketch Notes
Introduce the box and whisker plot, or box plot, with this 14-page self-contained lesson packet! It includes guided notes with doodles, a color by number activity, an in-class practice problems sheet, a maze, and real-life applications. It works well as a formal lesson, graphic organizer, scaffolded notes, or interactive notebooks. This item is part of the Ultimate Box & Whisker Plot Bundle (print + digital).What’s included… (14 pages total)⭐ Guided Notes (4 pages): how to construct and inte
Subjects:
Grades:
6th
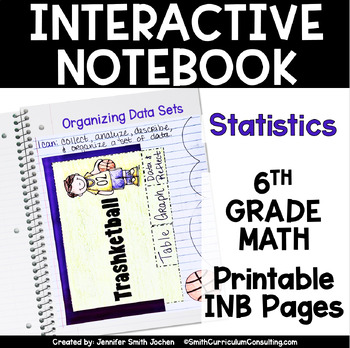
6th Grade Math Statistics Interactive Notebook Unit Printable TEKS CCSS
After starting an Interactive Notebook for 6th Grade Math, this unit provides not only the Flippables (foldable activities) but also items necessary to complete your INB lessons.This Sixth Grade Math Interactive Notebook provides alignment documents, teacher info pages for guided instruction (including the objective, vocabulary, standards, and directions), example photos, and all of the printable components for the lessons within the Statistics domain.Use the LOW-PREP interactive notebook lesson
Subjects:
Grades:
6th
Also included in: 4th, 5th and 6th Grade Math Interactive Notebook TEKS CCSS Aligned
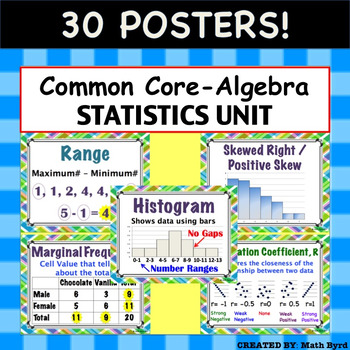
Common Core Algebra - Statistics Unit: Describing Data POSTERS
30 Posters! Each 8.5" x 11" in size. Posters are aligned with Common Core's Algebra - Statistics: Describing Data Unit. Posters Included:MeanMedianModeRangeInterquartile RangeOutlierMean Absolute DeviationMeasures of CenterMeasures of SpreadDot PlotHistogramBox PlotNormal/ Bell Shaped DistributionSkewed Right/Positive SkewSkewed Left/ Negative SkewUniform2 Way Frequency TableJoint FrequencyMarginal Frequency2 Way Relative Frequency TableConditional Relative FrequencyScatter PlotCorrelationCorrel
Subjects:
Grades:
8th - 11th
CCSS:
Also included in: Common Core Algebra 1 POSTERS - BUNDLE PRICE!
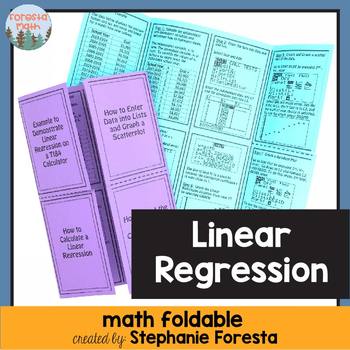
Linear Regression Foldable
A fun foldable to teach how to find the line of best fit, graph the line of best fit, find the correlation coefficient, graph a residual plot, and determine the goodness of fit.
The foldable was created using TI84's new operating system so if you haven't updated your calculators the instructions will not follow along exactly.
The foldable is completely filled in with instructions and images! It is a step by step tutorial for finding a linear regression on a graphing calculator.
Subjects:
Grades:
7th - 10th
Also included in: Functions Bundle
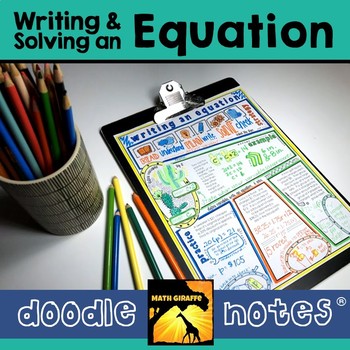
Writing an Equation Doodle Note
Steps for solving a problem by writing an equation - visual interactive "doodle notes" Students are guided through graphic notes for math problem solving through "Read, Understand, Plan, Write, Solve, and Check."When students color or doodle in math class, it activates both hemispheres of the brain at the same time. There are proven benefits of this cross-lateral brain activity:- new learning- relaxation (less math anxiety)- visual connections- better memory & retention of the content!Stude
Subjects:
Grades:
6th - 8th
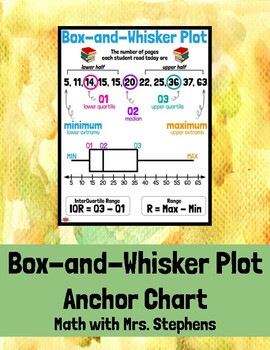
Box-and-Whisker Plot Anchor Chart
This anchor chart displays a data set with its corresponding box-and-whisker plot. It includes vocabulary of the "5 Number Summary", such as minimum, lower quartile, median, upper quartile, and maximum. The range and IQR are also represented. This can be printed one per page for individual student binders/notebooks or enlarged to be printed as a poster or anchor chart.
Subjects:
Grades:
6th - 8th
CCSS:
Also included in: 6th Grade Math (& More) Anchor Charts *BUNDLE*
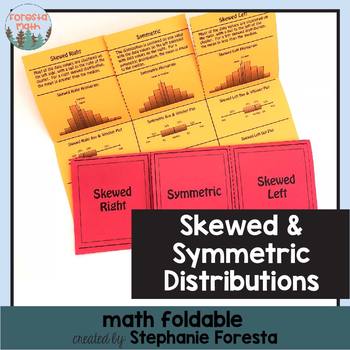
Skewed and Symmetric Distributions Math Foldable
A fun foldable with skewed and symmetric distributions (histograms, box & whisker plots, and line plots).
Subjects:
Grades:
7th - 11th
Types:
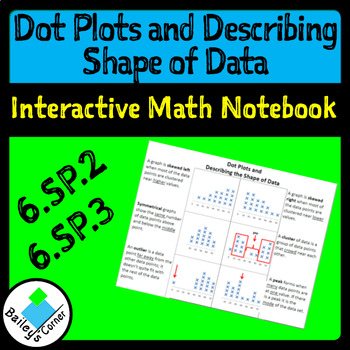
Dot Plots and Describing the Shape of Data for interactive notebook
This printable foldable includes pictures and definitions of dot plots including skewed left, skewed right, symmetrical, cluster, outlier, peak, and gap. Print two-sided, flip on short side. Competed version and version with blanks provided. 6.SP.2 and 6.SP.3
Don't forget to rate me to earn your TPT credits and follow me to be the first to see my new products and discounts. Contact me with any questions! :)
Visit my store to see my other products.
Like me on Facebook.
Follow me on Pinterest.
Ch
Subjects:
Grades:
6th
Also included in: Unit 7 Bundle: Statistics
Showing 1-24 of 397 results


