11 results
Graphing Common Core RST.6-8.3 resources
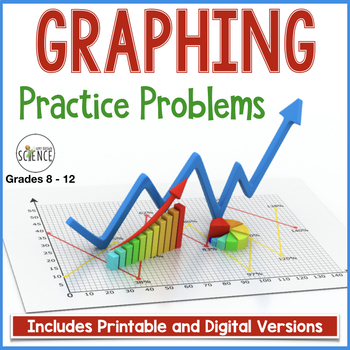
Graphing Practice Activity - Science Line Graphs, Data Analysis and Graphing
Graphing is a fundamental "must-have" skill in a science class. These practice problems will provide your students with a solid foundation and/or review of the basics of constructing line graphs. Further, students will practice analyzing data and using graphs to make predictions. If applicable to your teaching situation, you can have students complete their work in a digital Google Apps format. What is included in this resource?Editable and Printable 3-page student handoutPaperless Digital Vers
Grades:
8th - 12th
CCSS:
Also included in: Science Skills Bundle: Metrics, Measurement, Scientific Method, Graphing
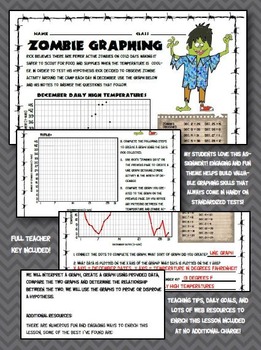
Fun zombie graphing worksheet! 5th 6th 7th Middle School elementary science math
Reinforce learning of graphing and graph interpretation with this fun zombie themed activity! This worksheet is perfect as a review prior to an exam or standardized test. Check out the PREVIEW for an idea of everything included in this engaging lesson!I created this lesson for my middle school students, but several teachers on my campus have used it with their upper elementary students. Perfect for math and science classrooms! I always feel the need to review graphing with my students, especiall
Grades:
5th - 7th
Types:
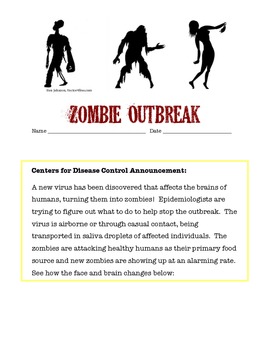
Investigating the Spread of a Viral Outbreak
Students in grades 5 - 9 model the spread of an infectious disease under the entertaining theme of a zombie outbreak. One student unknowingly is patient zero and students simulate the spread of an airborne illness. This highly engaging activity covers health topics, nature of science, and math skills as students graph data in a line plot. Higher level students can be challenged to find the function of the exponential growth of the outbreak.
Subjects:
Grades:
6th - 9th
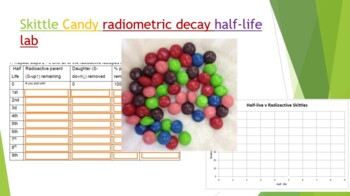
Skittle Radiometric Decay Half-life Lab
Did you know you can use Skittles candy to demonstrate absolute dating and radiometric decay! Buy a 1-4 lb bag at your local bulk warehouse store for savings. This lab is a great way to show how isotopes decay by shaking a plate full of random skittles. Students use Skittles to observe "Isotopes" decay over each half life. At the end of the lab (and only IF they have done all their work) they can enjoy their "daughter products". Skittles were used because they are durable, hypoallergenic, and th
Subjects:
Grades:
8th - 12th, Higher Education, Adult Education
Types:
NGSS:
HS-PS1-8
, HS-PS1-1
, HS-PS1-4
, HS-PS1-6
, MS-PS1-4
...
Also included in: Hands-on Science Semester Labs Bundle
Scientific Method Activity Practice Data Analysis Qualitative and Quantitative
This activity has students collect QUALITATIVE and QUANTITATIVE DATA about the candy in a mixed pack, such as Skittles or M&Ms. There are many candy activities out there, but none quite covered the quantitative and qualitative skills I wanted my middle school students to practice, so I designed my own! This lab is designed to be simple so that students can master beginner lab and data collection skills.In this activity, students will:READ an article about the differences between qualitativ
Subjects:
Grades:
6th - 8th
Types:
Also included in: Introduction to Experimentation Activity Set for Middle School Science

bar graph pie graph graphing thermometer lab PowerPoint STEM 3 4 5 6 TX TEKS
This fun, hands-on, lab and graphing activity gets your students thinking deeply and putting their knowledge of graphing, gathering data, and following instructions to the test. Perfect for test prep! Great way to incorporate science, technology, engineering, and math (STEM) concepts into a fun lesson. This lesson was created for elementary and middle school students and is great practice to help students reinforce the concepts of graphing, data gathering, creating bar graphs, creating pie graph
Subjects:
Grades:
3rd - 6th
Introduction to Graphing Lesson with Power Point and Assignment
This presentation includes a lot of the basic terms that students need to build a base for future mathematics courses. These principles are used in geometry, algebra, and trigonometry. I have used this as low as the eighth grade level and collegiate courses.
Key Terms:
Graph
Axes
Ordered Pairs
x-intercept
y-intercept
Distance Formula
This presentation has been left as a pptx file so animations can be added or taken away if they buyer wishes. The preview file is a pdf of the presentation. Both
Subjects:
Grades:
6th - 12th, Higher Education, Adult Education
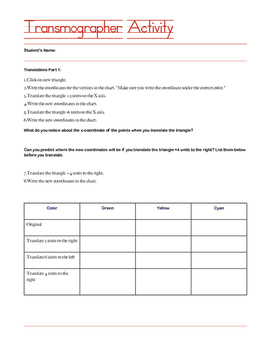
Translations, Reflections, and Rotations Activity
Use this worksheet to introduce transformations (translations, rotations, and reflections) or to get a deeper understanding of transformations. This worksheet uses a free online interactive called the transmographer.
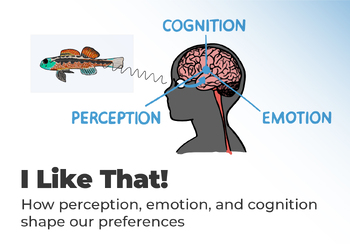
I Like That! Interdisciplinary Science Mini-Unit
This FREE, interdisciplinary mini-unit is all about how perception, emotion, and cognition shape our preferences. The Gist: Students will conduct experiments and analyze real scientific data as they learn about themselves. They'll learn how our eyes and brains interact to determine what we like and dislike, and apply this knowledge to fish research and the art of character design.Driving Questions:What makes humans and other animals perceive something as beautiful?How does the way our brain proc

Scientific Process- Best way to store popcorn
Simple science experiment using the scientific method to set up an experiment and to collect data. It has pages to fill in responses to teach students the scientific method. Students will learn from this experiment on how to set up their future experiments and how to use the scientific method to record their data.
It can be viewed as a mini lesson for learning how to use the scientific method for science projects. This will take 3-5 class sessions, depending on whether this is their first lesso
Subjects:
Grades:
5th - 7th
Types:
CCSS:
Earthworms Response to Temperature
This is a lab for Middle School and High School Science classes. It uses Red Wigglers, Eisenia fetida, to manipulate temperature variables to affect the worm's pulse rate. Red Wigglers are easy to work with and allow students to see the blow flow through the closed circulatory system and calculate the pulse rate of the worm. This lab uses graphing and data collection to help students understand how science accumulates data to make inferences about how conditions affect animals.
Showing 1-11 of 11 results


