85 results
Statistics Common Core 2.MD.D.10 resources
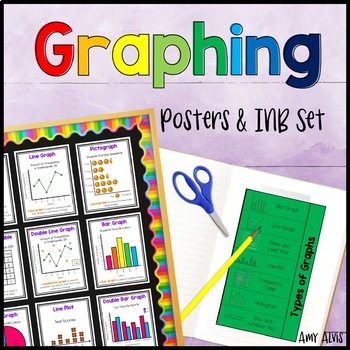
Graphing Posters & Interactive Notebook Bar Graph Picture Graph Line Plot
This poster or anchor chart and interactive notebook (INB) set includes FOURTEEN posters covering bar graphs, double bar graph, pictographs, picture graph, line graphs, double line graph, line plot, circle graphs, frequency tables, sector graph, stem and leaf plots, histograms, dot plots, parts of a graph and box and whisker plots. This set also includes SIX different foldable interactive notebook (INB) pages (that you print and put into a paper notebook) for students to take notes as well as a
Subjects:
Grades:
2nd - 5th
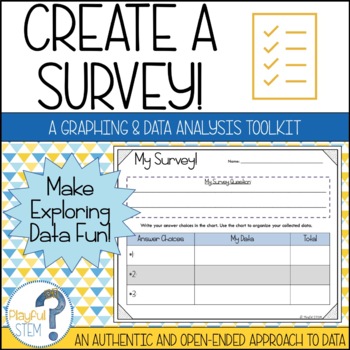
Create Your Own Survey: Collect, Organize, Graph, and Analyze Data
One of my best-selling TPT products -- now updated with a fresh look and new content!Teach Data Analysis the open-ended and engaging way -- through student-directed surveys!This resource pack is designed to help students follow the process of creating a survey: they will brainstorm questions, collect data, organize their obtained data, create multiple graphs to show their data, and then reflect on and analyze what their data tells them.The survey pack includes the following:Brainstorming Survey
Subjects:
Grades:
2nd - 5th
Types:
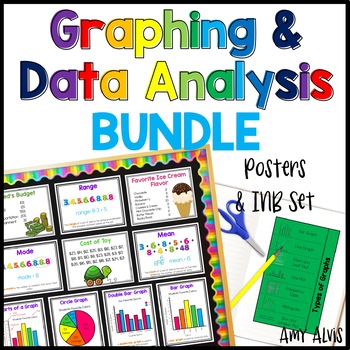
Graphing and Data Analysis Bundle Posters Interactive Notebook INB Anchor Chart
This bundle includes my Graphing Poster and Interactive Notebook (INB) set, my Data Analysis Poster and Interactive Notebook (INB) set and my Data Posters and Cards. Make sure to check the links below to see what comes with each set.This bundle includes:1. My best selling Graphing - Poster and INB Set.This poster and interactive notebook (INB) set includes FOURTEEN posters covering bar graphs, double bar graph, pictographs, picture graph, line graphs, double line graph, line plot, circle graphs
Subjects:
Grades:
2nd - 6th
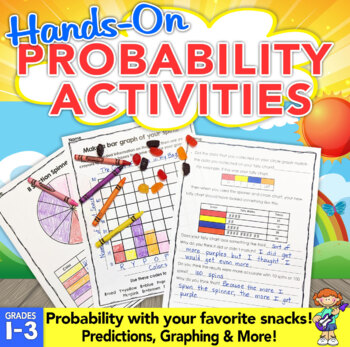
Probability Activities: Hands-On Probability with Snacks!
Probability activities are fun and engaging when you add treats! These fun probability activities allow students to experiment with probability using snacks.Students will use probability to predict, investigate, record data, and learn to use words to describe the chances of something happening.Students will love these probability activities because they are using skills with snacks! Each of the probability activities builds on each other and guides them step-by-step. Easy prep to print off the p
Subjects:
Grades:
1st - 3rd
Types:
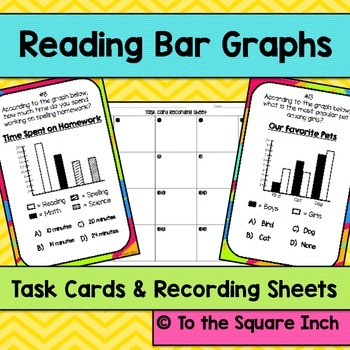
Bar Graphs Task Cards | Math Center Practice Activity
Reading Bar Graphs Task Cards and Record Sheets CCS: 2.MD.10, 3.MD.3
Included in this product:
*20 unique task cards dealing with reading and interpreting bar graphs with different scales (2 per page)
*4 different recording sheets
*Answer Key
Check out addition statistics products HERE
Subjects:
Grades:
2nd - 5th
Types:
Data Analysis Task Cards: A Data, Probability, and Graphing Math Activity
The ability to analyze data to create graphs and tables is a skill that students love to practice. These real life problem-solving scenarios offer students a fun opportunity to work with data in a way that is much more engaging than the standard math worksheet.
By analyzing the scenario presented on each task card, students will be able to determine probability and generate their own bar graphs, dot plots, and pictographs from a set of data.
Fun for math stations or centers, small group work,
Subjects:
Grades:
2nd - 5th
Types:
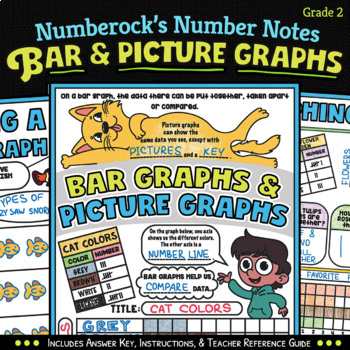
NUMBER NOTES ★ Bar Graphs & Picture Graphs Activity ★ Grade 2 Doodle Worksheets
Learning about how to organize and display data on bar and picture graphs is simply more fun when you can simultaneously doodle. It's also more effective (see why in the "about this product" section below). ============================COMPONENTS:1. 3 pages of Number Notes worksheets that give structure to your lesson plan while keeping your students highly engaged as they fill-out their notes, work on practice problems, and show off their mad doodling skillz!2. The Numberock Video* that aligns
Subjects:
Grades:
1st - 2nd
Types:
CCSS:
Roll, Tally, Graph - a data game for Math {Common Core Aligned}
This fun game can be played by your students either alone or in a small group and will help them put into practice what they know about tally marks, as well as giving them the opportunity to create a graph using real data they have collected.
Your PDF download includes a high-quality, full-colour die template for you to print, a student instruction page that you could use for a Mathematics Station, a tally sheet for students to collect data (this could be laminated and written on using a dry-er
Subjects:
Grades:
1st - 4th
Types:
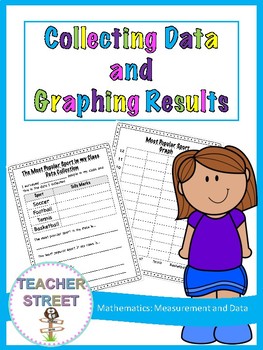
Collecting Data and Graphing Results
Have your students work through the process of collecting, representing and analyzing data.
This pack includes templates for the following topics;
Most Common Pet
Most Popular Sport
Favourite Fruit
Most Popular Book
Favourite Subject
Favourite Shape
Number of Siblings
+ a blank template for students to choose their own topic.
You might like your students to complete all the topics or simply allow them to choose a couple they are interested in.
Each graph comes in two versions.
Numbered up t
Subjects:
Grades:
1st - 3rd
Types:
Graphing & Probability Jeopardy Review Game
A fun and exciting way for students to review Graphs, Probability, and Combinations/Outcomes. This game is similar to a Jeopardy Game where students will answer the questions to earn points! This game puts a little twist on regular Jeopardy by turning it into what I call "Jailbreak Jeopardy". The students must work to answer the questions before the Math Thief gets away! The team with the most points, puts the Math Thief back in jail and wins the reward! (I usually provide students with a math p
Subjects:
Grades:
2nd - 4th
Also included in: Jailbreak Jeopardy Bundle
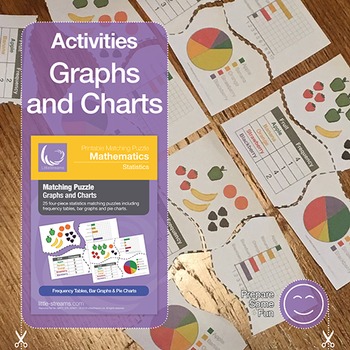
Matching Puzzle - Graphs and Charts
This statistics graphs 4-piece puzzle is a fun way to test students ability interpret data. Students match the images of fruit to the frequency table and two graph representations (pie charts and bar graphs).
It is designed to be easily cut with little wastage. So either the teacher or tutor can prepare the cards by cutting them before hand, or students can cut their own cards, giving them a chance to see the solutions before they attempt the puzzle.
Although this product is made in colour, it p
Subjects:
Grades:
2nd - 6th
Types:
CCSS:
Also included in: Matching Bundle One
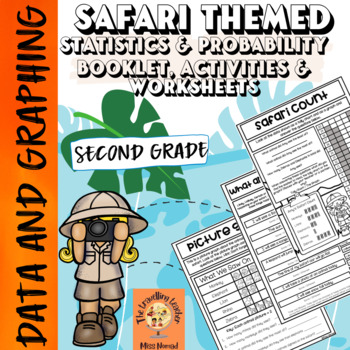
Second Grade Math: Data & Graphing Printable Booklet, Worksheets & Activities
This African Safari Themed Data & Graphing Printable Worksheets and Activity Pack features 19 different pages of printables and activities. This resource will bring the excitement of a safari and the students' love of animals into your maths lessons! It has minimal preparation, only requiring you to print the copies for your students with a fun activity at the end. It also comes with an answer key!This resource has been designed and aligned with the Year 2 Australian Curriculum, however, it
Subjects:
Grades:
1st - 3rd

What is a Scientist - Integrated STEM/STEAM Unit
What is a scientist? Do your students know how to think like a scientist? What do they notice? What questions do they ask themselves? How do they see the world?In this integrated unit, All About Scientists, students will explore this STEM career field. Students will enjoy learning about this fascinating career field and its variety. ELA Common Core standards, NGSS, and Common Core Math standards are all integrated into All About Scientists. The activities are fun and engaging. Students will LOVE
Subjects:
Grades:
2nd - 3rd
Types:
NGSS:
K-2-ETS1-3
, 3-ESS2-1
, 2-ESS1-1
, 3-5-ETS1-2
Also included in: Science and Engineering - STEM Activities - Science Activities
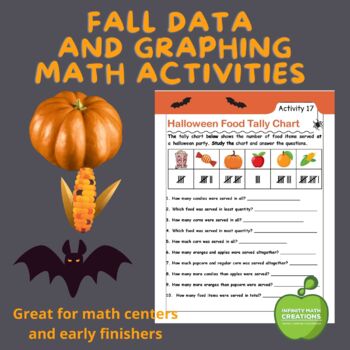
Data and Graph | Fall Activity Packet
Looking for a resource to help your students master data interpretation? This Fall Data and Graphing Activity Pack is perfect for reinforcing those skills.In this packet, students will use graphs and charts to answer questions about data sets. Each activity was curated with fall themes for colorful and creative interaction! The activities in this resource include:pictographsbar graphspie graphstally chartsfrequency chartsThere also includes a fun, halloween-themed project in which students wi
Subjects:
Grades:
2nd - 4th
Types:
Also included in: Halloween Math Activity Bundle: Arithmetic Fun Pack
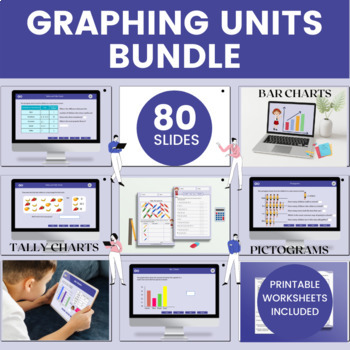
Handling Data - 2nd - 3rd Grade Bundle
Build data handling skills and conceptual knowledge with this enormous collection of interactive Handling Data math activities with free printable worksheets drafted for students of 2nd grade and 3rd grade.What you will get with this fraction math resource:3 products with over 80 interactive slides and dynamic graphics that will engage your third-grade studentsInteractive Drag and Drop activities with instant learner feedbackHandling data Worksheets with answers includedDifferentiated fraction q
Subjects:
Grades:
2nd - 3rd
Data Analysis & Probability: Word Problems Vol. 1 Gr. PK-2
**This is the chapter slice "Word Problems Vol. 1 Gr. PK-2" from the full lesson plan "Data Analysis & Probability"** About the FULL RESOURCE:For grades PK-2, our resource meets the data analysis & probability concepts addressed by the NCTM standards and encourages your students to learn and review the concepts in unique ways. Each task sheet is organized around a central problem taken from real-life experiences of the students. The pages of this resource contain a variety of content and
Grades:
PreK - 2nd
Types:
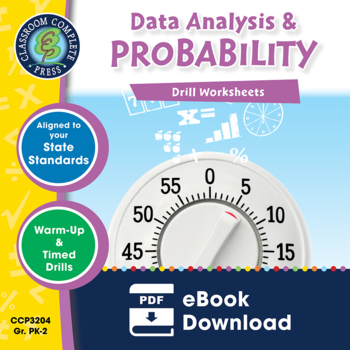
Data Analysis & Probability - Drill Sheets Gr. PK-2
Explore probabilities and start comprehending data that has been collected. Our resource provides warm-up and timed drill activities to practice procedural proficiency skills. The drill sheets provide a leveled approach to learning, starting with prekindergarten and increasing in difficulty to grade 2.About this Resource:Count the number of chickens on a farm using a bar graph. Find how many more roses than tulips are in a garden from a circle graph. Identify the likelihood of choosing a color
Subjects:
Grades:
PreK - 2nd
Types:
Also included in: Five Strands of Math - Drills BIG BOOK - BUNDLE Gr. PK-2
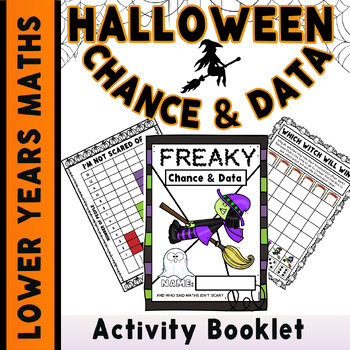
Halloween Maths Activity Booklet Lower Years Data & Chance Maths Activities
A booklet created for the lower years to complete full of freaky and fun maths activities that are Halloween themed and feel more like fun games to complete than learning! No Prep Required - Just Print and Go! Black and White or Color Options Available Complete over one day (whilst recovering from the candy high) or over the week of Halloween to celebrate! Activities Included in BookletData Activities Reading TalliesCounting Tallies Recording using Tallies Mixing and Matching Tallies to Numerals
Subjects:
Grades:
K - 2nd
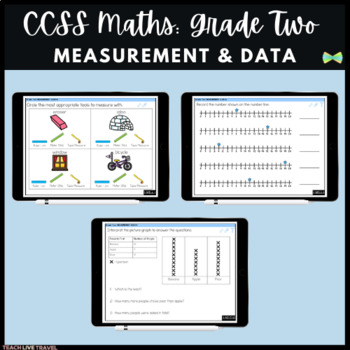
Grade Two Math | Measurement & Data | CCSS | Seesaw Activities | Online Learning
Do you need to review CCSS Measurement & Data with your learners?These CCSS Seesaw Math Activities by Teach, Live & Travel were designed with your little learners in mind, allowing them to develop their Measurement & Data knowledge, and consolidate their math skills in a purposeful, engaging way!How could I use these in my classroom?»Pre-Assessments or Post-Assessments - check your students prior knowledge and gaps to inform your learning and teaching»Small group teaching - work with
Subjects:
Grades:
1st - 3rd
Also included in: Grade Two Math BUNDLE | CCSS | Seesaw Activities | Online Learning
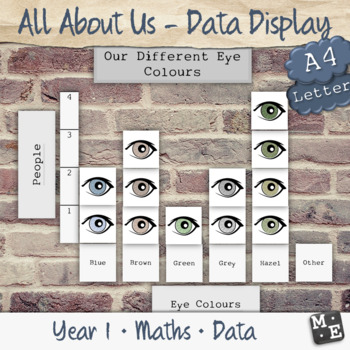
GRAPHING DATA Whole Class Gather and Represent Printable Picture Wall Display
Immerse your students in the process of representing their personal traits and characteristics as discrete data points, with this whole class printable data display. Simply choose from the selection of topics, ask students to represent their own self by colouring one of the corresponding data points, then invite them to add their picture to the bar or column graph (your choice) to represent the range of responses of the whole class.Through participation, students will:investigate a matter of int
Subjects:
Grades:
K - 2nd
Skittles Data Collecting
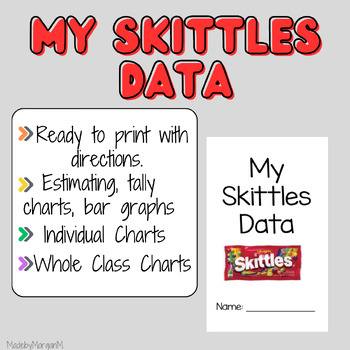
Skittles data collection! Use this in your classroom and get each kid a small pack of skittles and they can collect statistics and probability about their pack. Then they will create their own graph before putting the numbers all together to make a class graph! Students love doing this and getting a fun treat in the end. More example pictures coming soon.If you would like to see this product with other types of candy please feel free to send me a message and I would be happy to create it! Please
Subjects:
Grades:
2nd - 5th
Types:
Fruit Pie Charts Activity
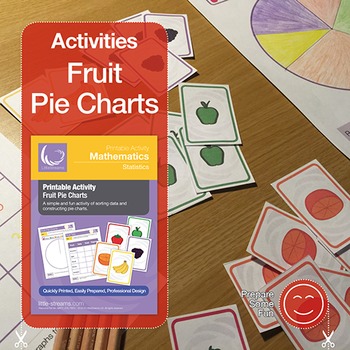
This activity offers a different way to teach tally and pie charts. Students choose 20 fruit cards from the fruit deck (or any amount you choose from the 45 cards if you wish to make things more challenging). We recommend that 20 cards offers the most interesting collection to work with, while also being a factor of 360. Students collect the data of their chosen cards and write it on the tally sheet. On the same sheet is a column for working out the number of degrees needed for constructing the
Subjects:
Grades:
2nd - 4th
Types:
Statistics Tests - Differentiated - Tally Charts and Column Graphs
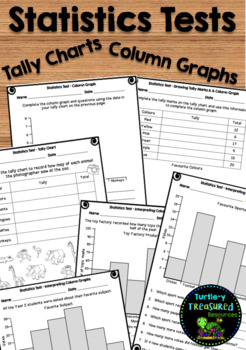
This test was designed for Year 1-3 students based on the statistics strand of the Australian Curriculum. It will also suit other curriculums as well. AUS and US spellings included.5 tests are included (7 pages):Drawing tally charts & column graphs test - Counting in 1s - 2 pagesDrawing tally charts & column graphs test - Counting in 2s - 1 pageInterpreting column graphs test - Counting in 2s - 1 pageInterpreting column graphs test - Counting in 5s - 1 pageInterpreting column graphs test
Subjects:
Grades:
1st - 3rd
Types:
Also included in: Maths Test Mega Bundle - Year 2
Mathematics, Basic Data Analysis :Picture & Bar Graph for preK-2nd Grade(20pages
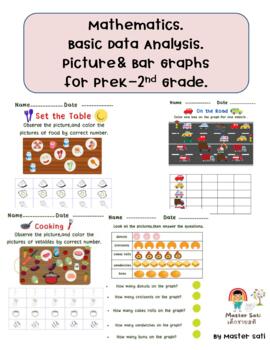
Mathematics, Basic Data Analysis :Picture & Bar Graph for preK-2nd Grade . The worksheet include 20 pages : The kid will enjoy playing and working with color pictures ,so each pages including theme that improve logic skill ,math and general knowledge together. Basic Data Analysis is important for mathematics and Statistics. Please rate this for help me to improve and provide new idea for you. Please support me by following me . Thank you.
Subjects:
Grades:
PreK - 2nd
Types:
Showing 1-24 of 85 results


