42 results
Earth sciences Common Core 3.MD.B.3 resources
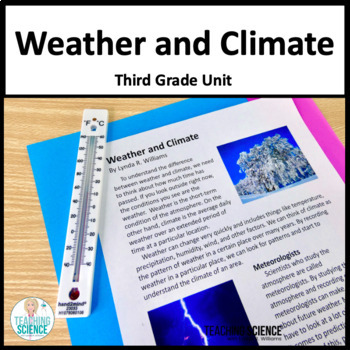
Weather and Climate Patterns & Weather Graphs and Charts 3-ESS2-1. & 3-ESS2-2.
Weather and Climate for Third Grade Students will learn about weather patterns and make weather graphs and weather charts. They will learn about forecasting the weather based on patterns. Students will design a solution to protect against natural hazards like floods or mudslides. This resource is designed to meet the NGSS for 3rd Grade Weather and Climate.This resource aligns with the NGSS Disciplinary Core Ideas of Weather and Climate, Natural Hazards, and Earth's Systems. This NGSS unit is com
Grades:
3rd
NGSS:
3-ESS3-1
, 3-ESS2-1
, 3-ESS2-2
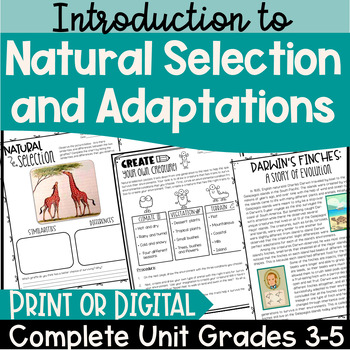
Natural Selection and Adaptations: Complete Unit with Reading Passages
A highly engaging NGSS aligned unit covering natural selection and adaptations. Students will enjoy the interesting reading passages based on scientific phenomena that are given as a central theme to each lesson. Reading comprehension questions are aligned with ELA standards. Also included are several fun, engaging activities that students will enjoy while gaining a deeper understanding of the content. Students sharpen their math skills by graphing data and analyzing results. Students also u
Subjects:
Grades:
3rd - 6th
Types:
NGSS:
3-LS4-3
, 3-LS4-2
, 3-LS4-4
Also included in: 3rd and 4th Grade Science Bundle (NGSS Aligned)
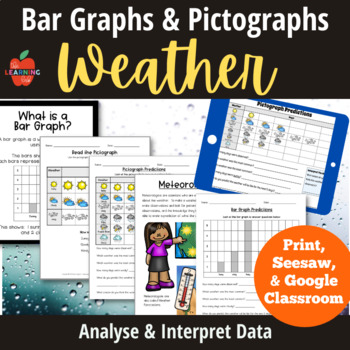
Weather NGSS ESS2: pictographs, bar graphs, forecasting, predictions, posters
Weather Bar Graphs and Pictographs for observing, analyzing and interpreting data! This package is both printable and digital (for Seesaw AND Google Classroom.) NGSS ESS2: Earth's Systems. Look at typical weather patterns, use data to make predictions, and consider connections to seasons!Printable 30 pages* Weather Forecast Worksheets (3 versions) *What is a Pictograph definition (2 versions) *Read the Pictographs worksheets *Meteorologist Fact Sheet (also with practice pictograph) *Pictograph P
Subjects:
Grades:
2nd - 6th
Plant Growth and Changes, Inquiry
Explore plant growth and changes in a hands-on and fun way with your students in this inquiry-based unit! Learn about plant growth, life cycles, and the needs of living things in this exciting, inquiry-based unit. First, students will learn foundational information and vocabulary about plants through two teacher-led activities and lessons. Next, students will participate in three engaging plant growth projects to experience plant growth and changes firsthand.What’s Included in this Plant Growth
Subjects:
Grades:
2nd - 4th
Types:
NGSS:
2-LS2-1
Also included in: Grade 3 Science Lessons BUNDLE, Digital and Printable

Weather Graphing - Precipitation - CCSS and NGSS Standards
Precipitation Graphing
Combine Common Core Math Standards and Next Generation Science Standards with this set of precipitation graphing worksheets. This product includes 4 sets of graphs and questions. Two graph sets show average monthly precipitation in various US states. The other two graph sets show average monthly precipitation in various countries. Each graph set comes with questions which ask students to compare the precipitation data of two locations. These graphs and questions includ
Subjects:
Grades:
2nd - 4th
Types:
CCSS:
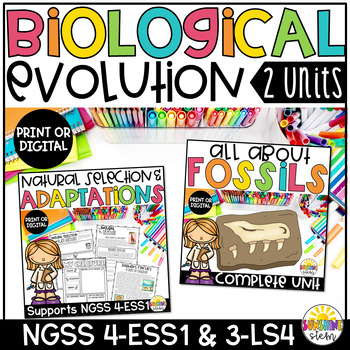
Biological Evolution: Unity and Diversity Complete NGSS Unit
⭐⭐ Now in print OR Google Slides! This amazing two unit bundle covers the extensive 3-LS4 performance expectations! The first unit covers;3-LS4-1 - Analyze and interpret data from fossils to provide evidence of the organisms and the environments in which they lived long ago. The print and go packet gives students everything they need and more for this performance expectation. Explore the world of fossils with your students with several interactive, engaging lessons. Your students will love the
Subjects:
Grades:
3rd - 5th
Types:
NGSS:
3-LS4-1
, 3-LS4-3
, 3-LS4-2
, 3-LS4-4
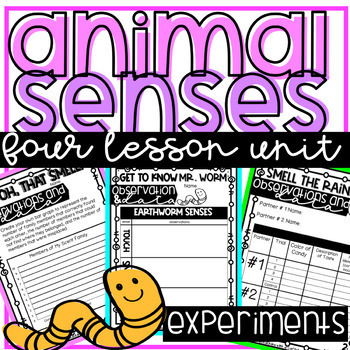
Animal and Human Senses Unit using the 5 Senses with Engaging Experiments
Just like humans, animals rely on their senses for survival. With this activity, your students will be exploring the different ways that animals use their senses to help interpret the world around them and, ultimately, survive!Your students will be completing hands on science experiments to help them better understand the importance of senses and the role they play in many animals' survival.This product includes:4 Engaging and Hands on Lessons15 Pages of Lesson Plans and Teacher TipsStudent Work
Subjects:
Grades:
3rd - 5th
Types:
NGSS:
3-5-ETS1-3
, 4-LS1-2
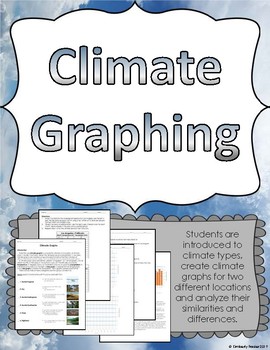
Climate Graphing Activity
Help students understand the basics of climate through this graphing activity. Not only does this address the science standards, it also integrates math and data analysis.Included in this printable graphing activity:-Introduction to what climate graphs are-Descriptions of 6 major types of climates-Directions for how to make a climate graph-Climate graph set ups-Data for two locations: New York City and Los Angeles-Analysis questions comparing the two climate graphs (use of CER)-Set of climate gr
Subjects:
Grades:
3rd - 9th
Types:
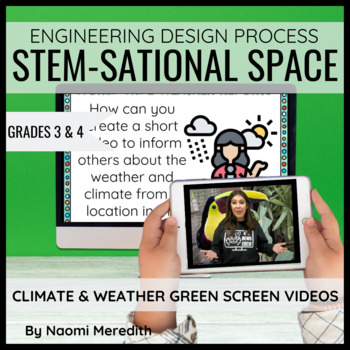
Weather for 3rd Graders STEM Project | Green Screen Video
How does the weather and climate change in different locations in the world? Understanding this information helps inform people when and where they might want to travel to a place. How can you create a short video to inform others about the weather and climate from a location in the world? By going through the Engineering Design Process, you’ll research about one location in the world and its weather and climate for each season and what people like to do for fun in this place. With this informat
Grades:
3rd - 4th
Types:
NGSS:
3-5-ETS1-3
, 3-ESS2-1
, 3-5-ETS1-1
, 3-ESS2-2
, 3-5-ETS1-2
Also included in: STEM Project Ideas for 3rd Grade | Growing Year Long Bundle
World Weather and Climate Stations Analysis and Graphing for Science and Math
Set up these 6 stations to encourage students to develop their graph-reading skills and help students recognize differences between weather and climate. Simple to use in math or science lessons. Just print, cut, and tape! For today's weather, please visit Accuweather.In this PacketPg 2 Preview Washington DC Fahrenheit (together as a class, one per student)Pg 3-4 Student Handout (print double sided, one per student)Pg 5 Buenos Aires/Cairo Fahrenheit (cut in two and tape one per station)Pg 6
Subjects:
Grades:
3rd - 6th
Types:
NGSS:
3-ESS2-1
, 3-ESS2-2
Also included in: World-focused Science and Math Activities for Upper Elementary
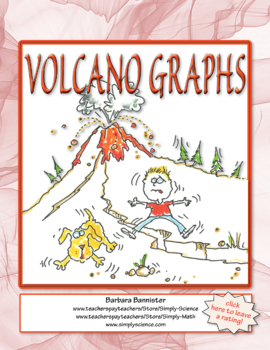
Graph Northwest Volcanoes Based on Location or Height
Quick and easy, just what you need to integrate science and math.Graph volcanoes based on location or height. Graph in meters or feet. Use prepared graphs or graph paper. I included my ten rules for graphing that you can format for your classroom using a Word™ file. I also included completed graphs so you'll have an answer key and students can compare their work to a completed graph.Thanks for visiting my Simply Science store. Please take a moment to leave a comment when you purchase a product.M
Subjects:
Grades:
3rd - 7th
Types:
CCSS:
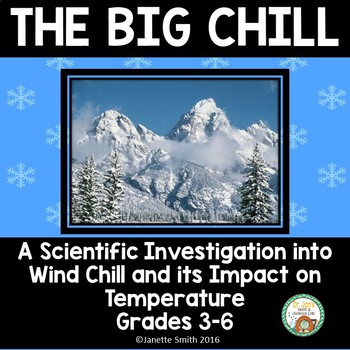
Temperature and Wind Chill: An Integrated Weather Activity
This engaging cooperative activity includes simulating a real life scenario to investigate the impact of wind and water on temperature. Math activities such as thermometer reading practice and making bar graphs are integrated within this activity.
Aligned to Next Generation and Common Core Standards.
Appropriate for grades 3-6.
Please leave feedback and earn TpT credits for future purchases.
If you like this download, you might also like these similar products:
Photosynthesis
Atomic Struc
Subjects:
Grades:
3rd - 6th
Types:
Also included in: Weather Super Bundle
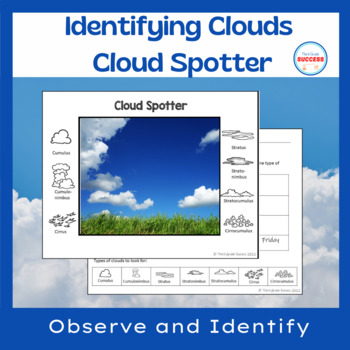
Learning About Clouds Activities
Students will love these learning about clouds activities. In this unit, students practice identifying clouds, and naming clouds. This cloud identification unit teaches students the names of six common clouds: Cumulus, Cumulonimbus, Stratus, Stratonimbus, Cirrus, Stratocumulus, and Cirrocumulus. Once students are introduced to each type of cloud, they are able to practice identifying the clouds they see with the cloud spotter. At the end of the week, students graph the clouds and reflect on what
Subjects:
Grades:
2nd - 3rd
Types:
NGSS:
3-ESS2-1
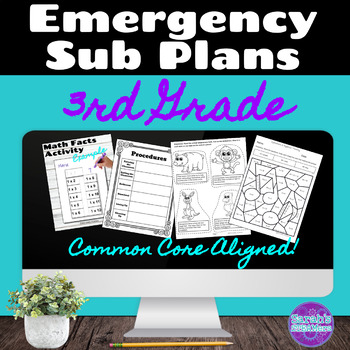
3rd Grade Emergency Sub Plans (Editable)
Don't get stuck without emergency plans for your guest teacher! Save time with these editable all-inclusive substitute plans! Product is an 82 page Google Slides. Included:Editable Sub Binder Covers (black & white)Editable Daily Schedules & Procedures10 math Worksheets & Answer Keys1 Math Activity2 Informational Text Reading Passages 1 Narrative Reading Passage3 Comprehension Pages & Answer Keys3 Writing activities & Drawing1 Word Search & Answer Key2 PE Games (1 indoor,
Subjects:
Grades:
3rd
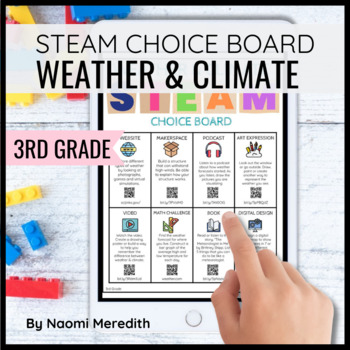
Weather for 3rd Graders | STEAM Choice Board
Have a one-stop location for various STEAM resources for third grade students to explore weather & climate further. Students can choose out of the 8 resources and activities provided to deepen their learning.While not designed to be the core lesson for teaching, this is a standards-based, extension resource that can be used alongside existing units. ---------------------------------------------Digital & Printable choice board with clickable links, QR codes and shortened-links to be acces
Grades:
3rd
Types:
NGSS:
3-ESS3-1
, 3-ESS2-1
, 3-ESS2-2
Also included in: 3rd Grade STEAM Choice Board Bundle
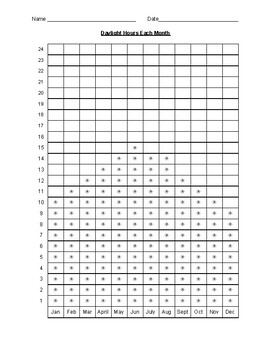
Daylight Hours by Month Graphing Activity - Differentiated
Practice math and science standards using real world data! Your students will analyze seasonal data by showing it in a graph and identifying patterns. This activity is excellent for lessons about the winter and summer solstices, or studying seasonal changes any time! This activity includes two versions to meet the needs of all of your learners.In version one, the graph includes sun shapes to help guide students to fill in the data correctly. Version 2 is a blank graph, and the students will read
Subjects:
Grades:
1st - 3rd
Types:
NGSS:
1-ESS1-1
, 3-ESS2-1
, 2-ESS1-1
, 1-ESS1-2
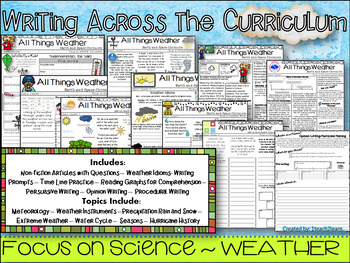
Weather - Science - Writing across the Curriculum - Reading Comprehension
This packet includes 10 lessons that can be used to teach all about Weather.Packet includes:6 Creative Writing Newspapers (18 total writing prompts)2 Non-fiction Passages with Comprehension Questions -Extension Activity: Write an opinion Piece about Hurricane Etymology 1 Newspaper that focuses on Weather IdiomsThis packet also helps students practice their Math and ELA skills! Math Skills:-Reading a Graph and answering comprehension questions-Reading and understanding a Time LineELA Skills:
Subjects:
Grades:
3rd - 4th
Types:
Distance Learning- Weather Journal with Claim, Evidence, Reasoning Method
The weather journal is a made for Google Slides journal that can be uploaded into your Google Classroom. Students will journal their weather observations each day for four weeks. They will make an original claim about what they will observe. Finally, they will analyze their journal and give explanations of the evidence and how it applies to their claim in reasoning. The Claim, Evidence, Reasoning Method is an accepted scientific inquiry for students.Many great conversations can be started with t
Subjects:
Grades:
1st - 3rd
NGSS:
3-ESS2-1
, 2-ESS1-1
Also included in: Science Investigations for Google Slides and Distance Learning
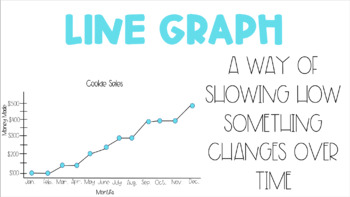
Types of Graphs Anchor Charts
Digital anchor charts depicting types of graphs -Pictograph-Bar Graph-Line Graph-Line PlotFONTS USED: PB Peppermint Cake PopPB Almond MilkPB Coffee Gives Life
Subjects:
Grades:
2nd - 5th
Types:
CCSS:
NGSS:
3-ESS3-1
Layers of a Forest Big Book Non-Fiction Text
You've found a great non-fiction resource about forest layers. NOTE:**This is not a Rain Forest Book!** Very few teacher resources talk just about forests that are in North America, let alone Oklahoma!! This big book is 11x17 in size and full color with actual photography taken from forests in Oklahoma. While teaching about the layers of the forest, there are math comprehension questions along the way, graphs, maps, and diagrams to read that are all related to forests! There are lots of non-
Subjects:
Grades:
K - 7th
Types:
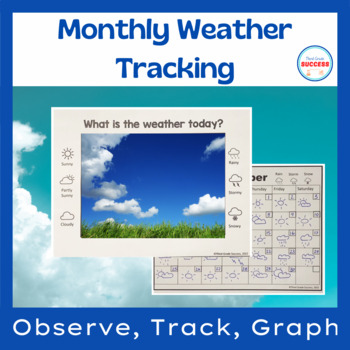
Monthly Weather Tracking
In this unit, students practice monthly weather graphing. They make a graph for the weather they have observed and tracked throughout the month. Students will make a weather spotter to view the weather. Keep one spotter in a window for students to observe the weather in the classroom and have students make their own spotter to take outside. Students will use their monthly weather calendars to record and track the weather they observe. Weather tracking is a quick and easy activity for students to
Subjects:
Grades:
1st - 3rd
Types:
NGSS:
K-ESS2-1
, 3-ESS2-1
, 1-ESS1-2
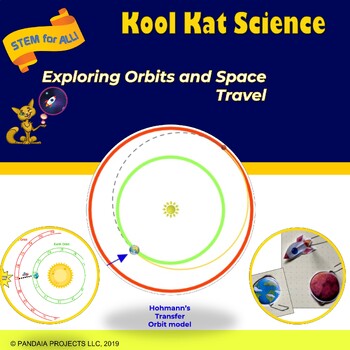
To Mars and Back
Humans have dreamed of visiting Mars since the 1880s, but getting there isn’t easy. Using a game board modeled after the orbits of Mars and Earth, student teams will plot a course to Mars and back. As they plan their Mars mission, students will use the same navigation method that NASA uses for interplanetary travel - the Hohmann Transfer Orbit. You can use this STEM activity, and the included Rover's slideshow to introduce a Solar System unit or a Mars rover design project. In addition to plann
Subjects:
Grades:
3rd - 5th
NGSS:
3-PS2-2
, 4-PS3-1
, 5-PS2-1
, 3-5-ETS1-2
Calendar and Weather Book
Want a great way to work a little more math and science into your daily routine? Use this calendar and weather book updated for the 2021-2022 school year! (The Word document allows you to edit the calendar each year, so you only have to buy it once.)Each month (August through June) has one page to graph the daily temperature and one page to graph the types of weather. Students can choose sunny, partly sunny, cloudy, rainy, stormy, or snowy. Each month also includes spaces to make two observation
Subjects:
Grades:
2nd - 4th
Types:
STEM Activity on Weather & Graph Worksheet
The Annual Precipitation Challenge is a hands-on approach to teaching about your local climate and annual precipitation patterns for grades 3-6. After completing this activity, students will be able to graphically display and interpret a city's annual precipitation, and estimate a location's monthly precipitation using water in 12 cups. Your curriculum is incomplete without this Earth Sciences activity!The annual precipitation is the total amount of precipitation (primarily rain and snow) that f
Subjects:
Grades:
3rd - 6th
Types:
NGSS:
3-ESS2-1
Showing 1-24 of 42 results

