103 results
Statistics Common Core 3.MD.B.3 resources
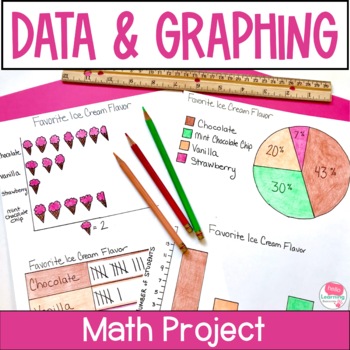
Data and Graphing Project - Real World Math Project Based Learning Activities
This data and graphing project gives your students a meaningful way to apply their data and graphing skills. Use this real world math project as an end of unit activity, enrichment activity or assessment. Easy to use and fun for students!Click the PREVIEW button above to see everything that is included in this fun math project!⭐ This resource includes:teacher information, directions and sample schedulesupply listgrading rubricstudent direction sheettwo data collection sheets (one for open ended
Subjects:
Grades:
4th - 6th
Types:
CCSS:
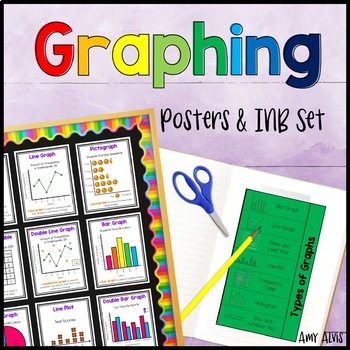
Graphing Posters & Interactive Notebook Bar Graph Picture Graph Line Plot
This poster or anchor chart and interactive notebook (INB) set includes FOURTEEN posters covering bar graphs, double bar graph, pictographs, picture graph, line graphs, double line graph, line plot, circle graphs, frequency tables, sector graph, stem and leaf plots, histograms, dot plots, parts of a graph and box and whisker plots. This set also includes SIX different foldable interactive notebook (INB) pages (that you print and put into a paper notebook) for students to take notes as well as a
Subjects:
Grades:
2nd - 5th
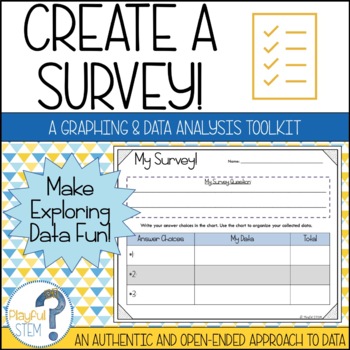
Create Your Own Survey: Collect, Organize, Graph, and Analyze Data
One of my best-selling TPT products -- now updated with a fresh look and new content!Teach Data Analysis the open-ended and engaging way -- through student-directed surveys!This resource pack is designed to help students follow the process of creating a survey: they will brainstorm questions, collect data, organize their obtained data, create multiple graphs to show their data, and then reflect on and analyze what their data tells them.The survey pack includes the following:Brainstorming Survey
Subjects:
Grades:
2nd - 5th
Types:
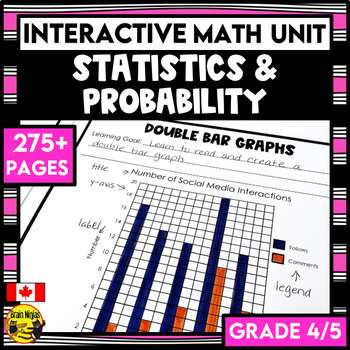
Statistics Graphing and Probability Interactive Math Unit | Grade 4/5
Stop searching for your statistics and graphing lessons. Everything you need to teach, practice, and assess bar graphs, pictographs, double graphs, stem and leaf plots and probability is included in this print-and-use unit. Your planning for your graphing unit is already done for you!This unit is part of the Full Year Interactive Math Unit Bundle for Grade 4/5. It comes with a bonus sequencing guide to help plan your whole year.This convenient resource includes:instructions for how to set up, as
Subjects:
Grades:
3rd - 5th
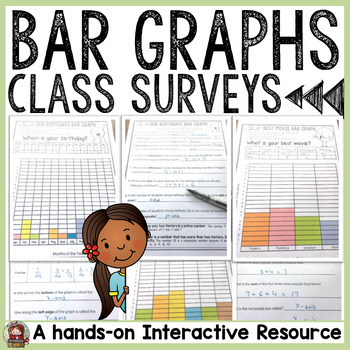
BAR GRAPHS: CLASS SURVEYS ACTIVITIES
BAR GRAPHS: SURVEYSThis Bar Graphs Class Surveys collection features collecting, graphing and interpreting data on topics your students will relate to. This is perfect for a getting-to-know-you back to school activity, or alternatively for applying graphing skills in real life situations.⭐ Separate folders featuring both British English and American spellings and terminology included.►What’s Included✅ 12 Class Surveys on topics of interest.✅ Choice of three Cover Sheets if compiling student su
Subjects:
Grades:
3rd - 6th
Types:
CCSS:
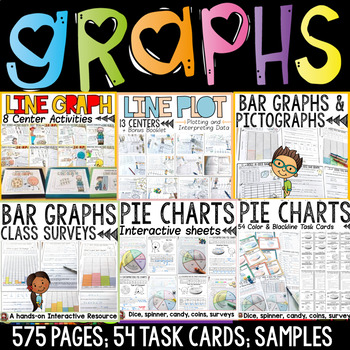
Bar Graphs Pictographs Line Graphs Line Plots Pie Charts Data Collection Bundle
The graphing bundle features interactive activities for creating and interpreting bar graphs, pictographs, line graphs, line plots and pie charts. Your entire graphing unit for a year!Separate folders featuring both British English and US spellings and terminology included.Great quality and value for this whopping 575 + page unit on graphing! Data is collected and interpreted using concrete materials such as visuals, dice, spinners, coins and other real-life objects and contexts. Further details
Subjects:
Grades:
2nd - 6th
Types:
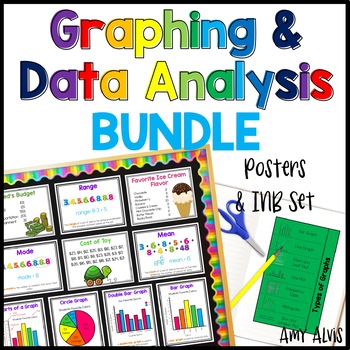
Graphing and Data Analysis Bundle Posters Interactive Notebook INB Anchor Chart
This bundle includes my Graphing Poster and Interactive Notebook (INB) set, my Data Analysis Poster and Interactive Notebook (INB) set and my Data Posters and Cards. Make sure to check the links below to see what comes with each set.This bundle includes:1. My best selling Graphing - Poster and INB Set.This poster and interactive notebook (INB) set includes FOURTEEN posters covering bar graphs, double bar graph, pictographs, picture graph, line graphs, double line graph, line plot, circle graphs
Subjects:
Grades:
2nd - 6th
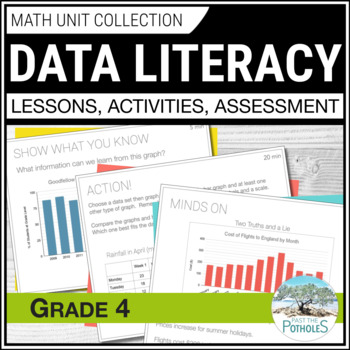
Grade 4 Ontario Data Management Unit Collecting Data Reading Graphs Infographic
Save time and stress! This COMPLETE Data Literacy unit includes EVERYTHING YOU NEED to guide students with collecting data, analyzing data, reading graphs, finding averages. It includes 3-part math Google Slides lessons, projectable slides for following along, taking notes, and creating anchor charts. It also includes practice worksheets, review activities, math centres, assessments, and Ontario math report card comments. Lesson topics: ❉ Describe and Compare Qualitative & Quantitative D
Subjects:
Grades:
3rd - 5th
Types:
CCSS:

Bar Graphs Whodunnit Activity - Printable & Digital Game Options
Nothing like a good criminal investigation to liven up bar graphs! Based off my popular CSI projects, I have created Whodunnits? The Whodunnits plan to focus on single content topics as opposed to units and will focus more on skill building than application. Every day can't be a project day, so Whodunnits can be an engaging out of their seat activity to practice important skills. In a Whodunnit?, students will work in teams to solve 10 practice problems that increase in difficult. After each ans
Subjects:
Grades:
3rd - 8th
Types:
CCSS:
Also included in: Pre-Algebra Whodunnit Activity Bundle - Printable & Digital Game Options
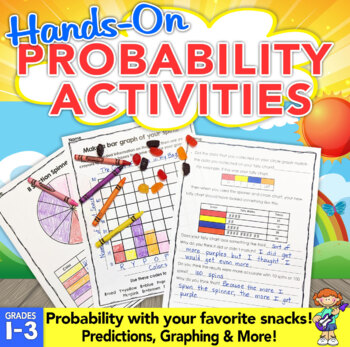
Probability Activities: Hands-On Probability with Snacks!
Probability activities are fun and engaging when you add treats! These fun probability activities allow students to experiment with probability using snacks.Students will use probability to predict, investigate, record data, and learn to use words to describe the chances of something happening.Students will love these probability activities because they are using skills with snacks! Each of the probability activities builds on each other and guides them step-by-step. Easy prep to print off the p
Subjects:
Grades:
1st - 3rd
Types:
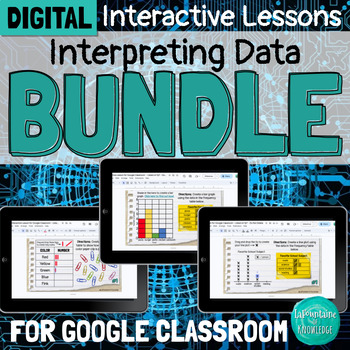
DIGITAL Interpreting Data Interactive Lesson Bundle for Google Classroom
This bundle of 3 digital interactive math lessons for Google Classroom teaches interpreting categorical and numerical data using frequency tables, bar graphs, and line plots. Each lesson includes: a video lesson (YouTube and Loom viewing options included) practice problems and activitiesteacher directions and answer keysThese lessons are ready to assign and easy for students to complete independently. Students will learn:important vocabulary - title, categories, tally marks, key, categorical dat
Subjects:
Grades:
3rd - 5th
Types:
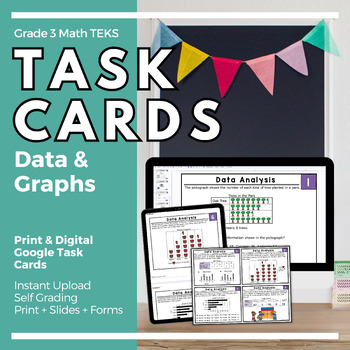
Grade 3 TEKS-STAAR Task Cards Data Analysis | Digital Google Forms & Slides
The TEKS aligned, multi-step word problems digital task cards are a great resource for third grade students to practice and review math concepts. This resource comes in two formats, Google Slides and Google Forms, making it easy for teachers to assign as a review, practice, math station activity, quiz, assessment, or test-prep! One of the best features of this resource is that it is paperless and self-grading, saving teachers time and energy. The engaging word problems are written specifically f
Subjects:
Grades:
3rd
Types:
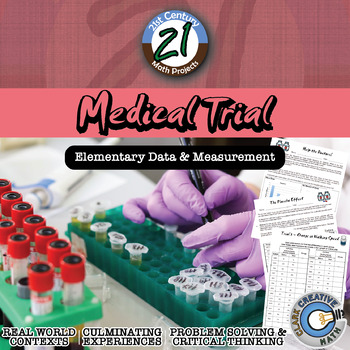
Medical Trial -- Elementary Data Edition - Medical - 21st Century Math Project
Bring your students into the world of double blind medical studies. Every day, doctors and hospitals rely on scientific studies and research to make healthcare decisions for patients. Are some medicines more effective than others? Do certain types of patients benefit more from certain types of treatments? Due to the security of medical records, studies are somewhat limited in their scope and are generally carried out at universities and research hospitals. At these facilities ground breaking wo
Subjects:
Grades:
3rd - 5th
Types:
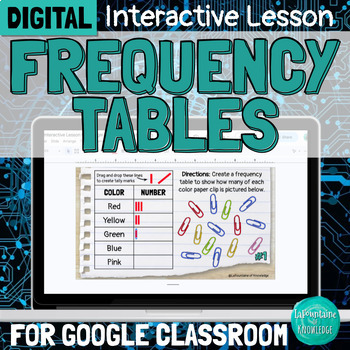
DIGITAL Frequency Tables Interpreting Data Interactive Lesson
This interactive Google Slides lesson introduces students to frequency tables and demonstrates how to interpret both categorical and numerical data. The lesson covers:the parts of a frequency table (title, categories, and tally marks)the difference between categorical and numerical datahow to interpret data (answer questions) using a frequency tablehow to create a frequency table This resource includes:a 9 minute video lesson (YouTube and Loom viewing options provided) 14 practice problems - stu
Subjects:
Grades:
3rd - 5th
Types:
Also included in: DIGITAL Interpreting Data Interactive Lesson Bundle for Google Classroom
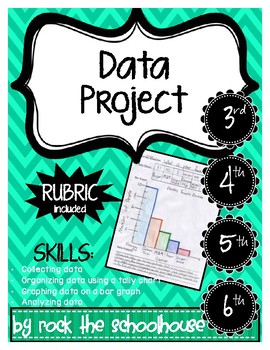
Collect, Organize, Graph, and Analyze Data Project
Includes the WHOLE process:
Generate a survey question to collect data
Record survey results in an organized tally chart
Graph data on a bar graph
Analyze data (observations & inferences) in a written paragraph
Many uses:
Homework
Formative Assessment
Summative Assessment
Review
Differentiated Assignment
Includes:
Student-friendly Directions
Data Recording Sheet
Rubric
Subjects:
Grades:
3rd - 6th
Types:
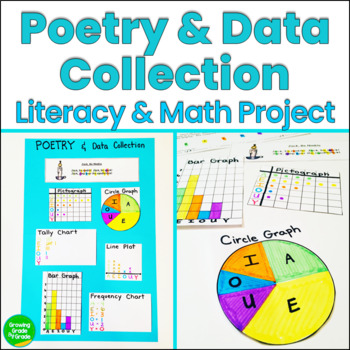
Graphing and Data Project
Kids will have a blast integrating literacy, data, and graphing by using "real-life" data! Students will also enjoy various poems and nursery rhymes while they practice collecting and displaying the number of vowels used in a poem. Poems are included!Kids read a short poem, count all the vowels, then display them on different graphs and charts. Sample images are included. Poems are included as well as suggestions for other great poems. The project is extended with questions for discussion and/or
Subjects:
Grades:
4th - 6th
Types:
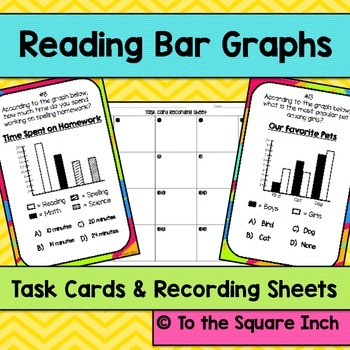
Bar Graphs Task Cards | Math Center Practice Activity
Reading Bar Graphs Task Cards and Record Sheets CCS: 2.MD.10, 3.MD.3
Included in this product:
*20 unique task cards dealing with reading and interpreting bar graphs with different scales (2 per page)
*4 different recording sheets
*Answer Key
Check out addition statistics products HERE
Subjects:
Grades:
2nd - 5th
Types:
Data Analysis Task Cards: A Data, Probability, and Graphing Math Activity
The ability to analyze data to create graphs and tables is a skill that students love to practice. These real life problem-solving scenarios offer students a fun opportunity to work with data in a way that is much more engaging than the standard math worksheet.
By analyzing the scenario presented on each task card, students will be able to determine probability and generate their own bar graphs, dot plots, and pictographs from a set of data.
Fun for math stations or centers, small group work,
Subjects:
Grades:
2nd - 5th
Types:
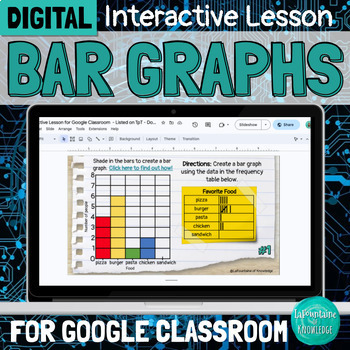
DIGITAL Bar Graphs Interpreting Data Interactive Lesson for Google Classroom
This interactive Google Slides lesson introduces students to interpreting categorical and numerical data using bar graphs (including scaled bar graphs).The lesson covers: how to create a bar graph the difference between categorical and numerical datahow to interpret data using different types of bar graphs to answer questions how to read a scaled bar graphThis resource includes: a 10.5 minute video lesson (YouTube and Loom viewing options included) 21 practice problems - students shade in sectio
Subjects:
Grades:
3rd - 5th
Types:
Also included in: DIGITAL Interpreting Data Interactive Lesson Bundle for Google Classroom
Roll, Tally, Graph - a data game for Math {Common Core Aligned}
This fun game can be played by your students either alone or in a small group and will help them put into practice what they know about tally marks, as well as giving them the opportunity to create a graph using real data they have collected.
Your PDF download includes a high-quality, full-colour die template for you to print, a student instruction page that you could use for a Mathematics Station, a tally sheet for students to collect data (this could be laminated and written on using a dry-er
Subjects:
Grades:
1st - 4th
Types:
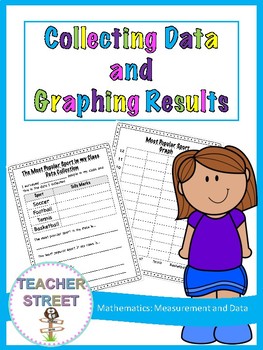
Collecting Data and Graphing Results
Have your students work through the process of collecting, representing and analyzing data.
This pack includes templates for the following topics;
Most Common Pet
Most Popular Sport
Favourite Fruit
Most Popular Book
Favourite Subject
Favourite Shape
Number of Siblings
+ a blank template for students to choose their own topic.
You might like your students to complete all the topics or simply allow them to choose a couple they are interested in.
Each graph comes in two versions.
Numbered up t
Subjects:
Grades:
1st - 3rd
Types:
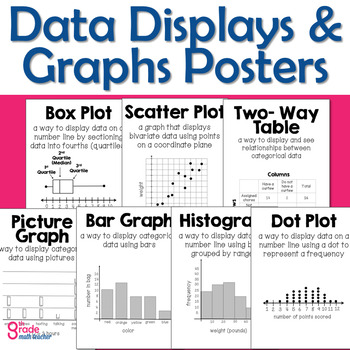
Types of Graphs and Data Displays Posters
Need visuals for your statistics unit? These 7 printable posters show definitions and examples for students of vocabulary they can reference as they learn. They are simple, easy to read, and informative. It's math classroom décor with an important purpose!Hang these posters as part of your word wall all year or when you teach your statistics unit. They are the perfect visual aids and have information students need.Make them colorful! The posters are black and white and can be printed on any colo
Subjects:
Grades:
3rd - 8th
Types:
Graphing & Probability Jeopardy Review Game
A fun and exciting way for students to review Graphs, Probability, and Combinations/Outcomes. This game is similar to a Jeopardy Game where students will answer the questions to earn points! This game puts a little twist on regular Jeopardy by turning it into what I call "Jailbreak Jeopardy". The students must work to answer the questions before the Math Thief gets away! The team with the most points, puts the Math Thief back in jail and wins the reward! (I usually provide students with a math p
Subjects:
Grades:
2nd - 4th
Also included in: Jailbreak Jeopardy Bundle
Data Analysis & Probability - Task & Drill Sheets Gr. 3-5 - Distance Learning
Create graphs using gathered information and accurately read the data to make predictions. Our resource introduces the mathematical concepts taken from real-life experiences, and provides warm-up and timed practice questions to strengthen procedural proficiency skills. The task and drill sheets provide a leveled approach to learning, starting with grade 3 and increasing in difficulty to grade 5.About this Resource:Create circle graphs to match the fractions. Survey your class to find out what p
Subjects:
Grades:
3rd - 5th
Types:
Showing 1-24 of 103 results


