7 results
1st grade graphing lectures
Data Representation Powerpoint
The presentation contains: 1) TALLY MARKS Learning Objectives. Definition of a tally mark. Uses of tally mark. How to count a tally mark. Tally Mark Chart. Construction of a tally mark table with an example. Application on real life problems on tally mark. Read and Interpret a tally mark table.The presentation contains: 2) FREQUENCY DISTRIBUTION TABLEDefinition of a Frequency Distribution Table. Types of Frequency Distribution Table: a) Discrete Frequency Distribution Table (Ungrouped).b) C
Subjects:
Grades:
1st - 10th, Higher Education, Staff
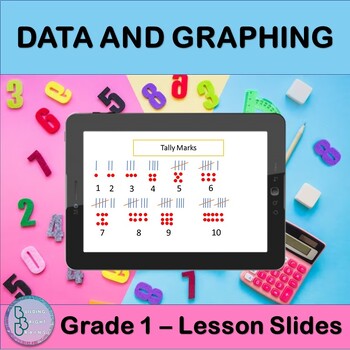
Data and Graphing | PowerPoint Lesson Slides Tally Chart Pictograph Bar Graph
Are you teaching your students about Data and Graphing? This resource is great for you for First Grade! Plenty of examples and application exercises are included. You can also easily convert this to a Google Slides lesson by dragging it into your Google Drive.What is included?✦ 6 total slides for notes, examples and applications.✦ All steps are animated to allow the teacher to explain them gradually. At the end of the lesson, students will be able to ✦ Make a Tally Chart✦ Make a Pictograph✦ Read
Grades:
1st - 2nd
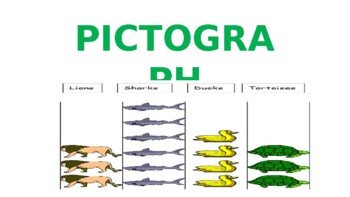
Pictograph Powerpoint
The presentation contains:Learning Objectives.Definition of a Pictograph.Parts of a pictograph.Tips for construction of pictograph.Steps to construct pictograph with an example.Scaling and drawing a pictograph.Read and Interpret a pictograph.
Subjects:
Grades:
1st - 7th, Staff
Also included in: Data Representation Powerpoint

Collecting Data Smartboard Lesson
This is a math lesson on tally tables, frequency tables, and collecting data. It is geared for 3rd graders and meets the Georgia Performance (GPS) standards for math. This lesson has 9 slides and includes an essential question and a summarizing activity. It is designed to be an introduction to this topic and provide guided practice.
Subjects:
Grades:
1st - 3rd

Using Data
This is a math lesson on interpreting results (data) from a survey. It is geared for 3rd graders and meets the Georgia Performance (GPS) standards for math. This lesson has 8 slides and includes an essential question and a summarizing activity. It is designed to be an introduction to this topic and provide guided practice.
Subjects:
Grades:
1st - 3rd

Using and Creating Grids
This is a math lesson on creating and using grids and ordered pairs. It is geared for 3rd graders. This lesson has 7 slides and includes an essential question lots of practice for students. It is designed to be an introduction to this topic and provide guided practice.
Subjects:
Grades:
1st - 4th
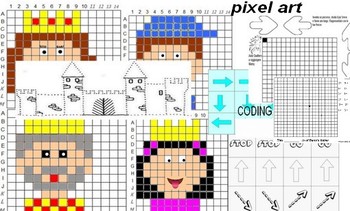
PRINCESS, LAB, 10 PAGES. CODING, PIXEL ART, MYSTERY FIGURE
PRINCESS LABTHE LABORATORY INCLUDES- 4 MYSTERY FIGURE (NAVAL BATTLE SHEETS)-1 MYSTERY FIGURE (ARROWS ROUTE)-1 ARROWS ROUTE HORSES-CASTLE-2 SHEETS ARROWS WITH EXPLANATIONS
Subjects:
Grades:
K - 4th
Types:
Showing 1-7 of 7 results


