86 results
7th grade statistics lectures
Statistics Unit
Fun with Box and Whiskers, Mean, Median, Mode, Range, Five Number Summary using anything from McDonald's food to M&M's with SKittles.
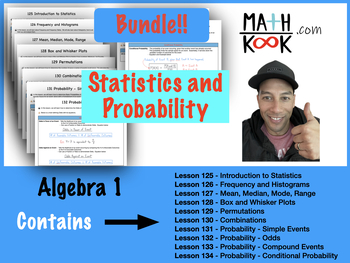
Algebra 1 - Statistics and Probability - BUNDLE!!
This Bundle contains 10 of ~134 Algebra 1 Lessons available. This bundle focuses on Statistics and Probability! It covers basic topics for Statistics, including Mean, Median, Mode, Range, how to calculate Frequency, Drawing Histograms, Box and Whisker Plots, Permutations, Combinations, and many types of Probabilities, including how to find Odds. All lessons in Bundle below.Lesson 125 - Introduction to Statistics Lesson 126 - Frequency and HistogramsLesson 127 - Mean, Median, Mode, RangeLesson 12
Subjects:
Grades:
7th - 9th
Types:

Statistics Module Bundle
Dear Customers!This Statistics Module Bundle file contains 18 lectures which are covered during Statistics Module.Each lecture containing:- Lecture PPT- Test Bank with answers for each lecture - Exercises for seminars/lectures with answers
Subjects:
Grades:
6th - 12th, Higher Education, Adult Education, Staff
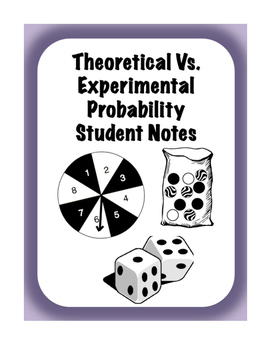
Theoretical vs Experimental Probability Interactive Scaffolded/Guided Notes
These notes provide a clear explanation of theoretical and experimental probability with examples involving spinners, die, and marbles. Students will also get extra practice converting their probabilities to decimals, fractions, and percents along with predicting the probability of an event happening.
There is also a flipped classroom video that goes along with these notes that can be accessed at-
https://youtu.be/FAHvmiYJA1A
Subjects:
Grades:
5th - 8th

Changing the Face of Math Education Book 2
Whether you are a teacher, a parent, a student, strong in math or weak in math, the material in this book will change the way you view and compute math in the future. Be ready to be amazed and intrigued as you go through the book by all the information you probably were never exposed to in your math education. This book will answer many questions you may have had in the past while giving you a much stronger conceptual understanding of math. This book will expose you to many different problem-sol
Subjects:
Grades:
4th - 12th
Types:
Statistics (Mean, Median, Mode, Box and Whiskers, with the five number summary
Teaching statistics to 6th graders can be an engaging experience by making the concepts relatable and visual. Five-Number SummaryThe five-number summary includes the minimum, first quartile, median, third quartile, and maximum. These values help summarize a set of data and are used in creating box plots. Start by having students collect a small dataset, such as their test scores, and calculate these five points to see how data is distributed.Box and Whisker PlotsA box and whisker plot (box plot)
Subjects:
Grades:
5th - 7th
Types:
Also included in: Statistics Unit
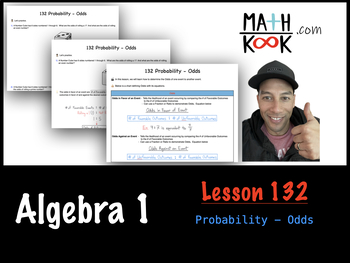
Algebra 1 - Probability - Odds (132)
This is 132 of ~134 Algebra 1 Lectures available. Each Lesson consists of the following 3 items. Bundle Available for all ~134 Lessons too... and much cheaper to purchase them all.1) Lecture Notes w/Examples2) Worksheet to practice3) KEY for Worksheet with full solutions, step-by-stepWhat does Lesson 132 cover? In this lesson, we will learn how to determine the Odds of one event to another event. To connect, follow me on Instagram, @theMathKookEnjoy!
Subjects:
Grades:
7th - 9th
Types:
Also included in: Algebra 1 - COMPLETE 134 Lessons - Covers ALL Topics - BUNDLE!!
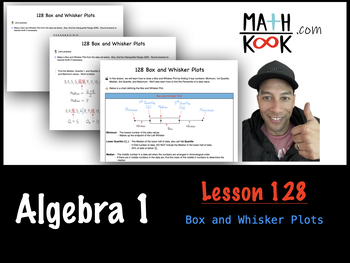
Algebra 1 - Box and Whisker Plots (128)
This is 128 of ~134 Algebra 1 Lectures available. Each Lesson consists of the following 3 items. Bundle Available for all ~134 Lessons too... and much cheaper to purchase them all.1) Lecture Notes w/Examples2) Worksheet to practice3) KEY for Worksheet with full solutions, step-by-stepWhat does Lesson 128 cover? In this lesson, we will learn how to draw a Box and Whisker Plot by finding 5 key numbers: Minimum, 1st Quartile, Median, 3rd Quartile, and Maximum. We’ll also learn how to find
Subjects:
Grades:
7th - 9th
Types:
Also included in: Algebra 1 - COMPLETE 134 Lessons - Covers ALL Topics - BUNDLE!!
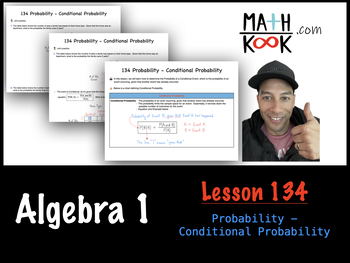
Algebra 1 - Probability - Conditional Probability (134)
This is 134 of ~134 Algebra 1 Lectures available. Each Lesson consists of the following 3 items. Bundle Available for all ~134 Lessons too... and much cheaper to purchase them all.1) Lecture Notes w/Examples2) Worksheet to practice3) KEY for Worksheet with full solutions, step-by-stepWhat does Lesson 134 cover? In this lesson, we will learn how to determine the Probability of a Conditional Event, which is the probability of an event occurring, given that another event has already occurr
Subjects:
Grades:
7th - 9th
Types:
Also included in: Algebra 1 - COMPLETE 134 Lessons - Covers ALL Topics - BUNDLE!!
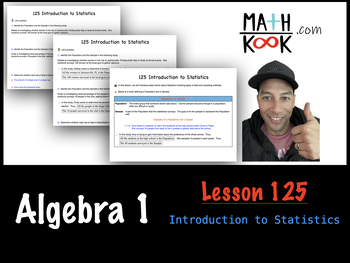
Algebra 1 - Introduction to Statistics (125)
This is 125 of ~134 Algebra 1 Lectures available. Each Lesson consists of the following 3 items. Bundle Available for all ~134 Lessons too... and much cheaper to purchase them all.1) Lecture Notes w/Examples2) Worksheet to practice3) KEY for Worksheet with full solutions, step-by-stepWhat does Lesson 125 cover? In this lesson, we will introduce basic terms about Statistics including types of data and sampling methods. To connect, follow me on Instagram, @theMathKookEnjoy!
Subjects:
Grades:
7th - 9th
Types:
Also included in: Algebra 1 - COMPLETE 134 Lessons - Covers ALL Topics - BUNDLE!!
Algebra 1 - Probability - Compound Events (133)
This is 133 of ~134 Algebra 1 Lectures available. Each Lesson consists of the following 3 items. Bundle Available for all ~134 Lessons too... and much cheaper to purchase them all.1) Lecture Notes w/Examples2) Worksheet to practice3) KEY for Worksheet with full solutions, step-by-stepWhat does Lesson 133 cover? In this lesson, we will learn how to determine the Probability of Compound Events, which means 2 or more events. To connect, follow me on Instagram, @theMathKookEnjoy!
Subjects:
Grades:
7th - 9th
Types:
Also included in: Algebra 1 - COMPLETE 134 Lessons - Covers ALL Topics - BUNDLE!!
Algebra 1 - Probability - Simple Events (131)
This is 131 of ~134 Algebra 1 Lectures available. Each Lesson consists of the following 3 items. Bundle Available for all ~134 Lessons too... and much cheaper to purchase them all.1) Lecture Notes w/Examples2) Worksheet to practice3) KEY for Worksheet with full solutions, step-by-stepWhat does Lesson 131 cover? In this lesson, we will learn how to determine Basic Probabilities of simple events. We will also learn how to find a Sample Space for an event, along with a Complement of an eve
Subjects:
Grades:
7th - 9th
Types:
Also included in: Algebra 1 - COMPLETE 134 Lessons - Covers ALL Topics - BUNDLE!!
Algebra 1 - Combinations (130)
This is 130 of ~134 Algebra 1 Lectures available. Each Lesson consists of the following 3 items. Bundle Available for all ~134 Lessons too... and much cheaper to purchase them all.1) Lecture Notes w/Examples2) Worksheet to practice3) KEY for Worksheet with full solutions, step-by-stepWhat does Lesson 130 cover? In this lesson, we will learn how to determine the number of ways a series of events could occur when order does not matter. To do so, we will focus on Combinations this lesson.
Subjects:
Grades:
7th - 9th
Types:
Also included in: Algebra 1 - COMPLETE 134 Lessons - Covers ALL Topics - BUNDLE!!
Algebra 1 - Permutations (129)
This is 129 of ~134 Algebra 1 Lectures available. Each Lesson consists of the following 3 items. Bundle Available for all ~134 Lessons too... and much cheaper to purchase them all.1) Lecture Notes w/Examples2) Worksheet to practice3) KEY for Worksheet with full solutions, step-by-stepWhat does Lesson 129 cover? In this lesson, we will learn how to determine the number of ways a series of events could occur. To calculate the number of ways an event can occur, we will focus on the Fundame
Subjects:
Grades:
7th - 9th
Types:
Also included in: Algebra 1 - COMPLETE 134 Lessons - Covers ALL Topics - BUNDLE!!
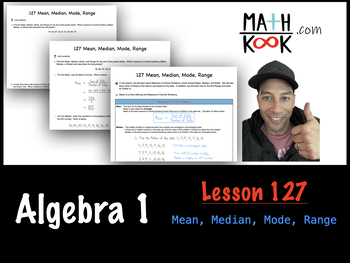
Algebra 1 - Mean, Median, Mode, Range (127)
This is 127 of ~134 Algebra 1 Lectures available. Each Lesson consists of the following 3 items. Bundle Available for all ~134 Lessons too... and much cheaper to purchase them all.1) Lecture Notes w/Examples2) Worksheet to practice3) KEY for Worksheet with full solutions, step-by-stepWhat does Lesson 127 cover? In this lesson, we will learn about Measure of Central Tendency, which include Mean, Median, and Mode. We will also learn which of these is the best to use based on the data. In
Subjects:
Grades:
7th - 9th
Types:
Also included in: Algebra 1 - COMPLETE 134 Lessons - Covers ALL Topics - BUNDLE!!
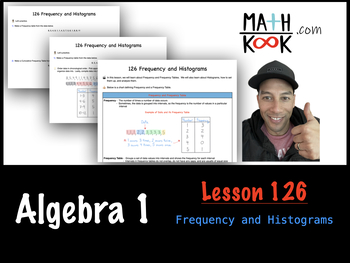
Algebra 1 - Frequency and Histograms (126)
This is 126 of ~134 Algebra 1 Lectures available. Each Lesson consists of the following 3 items. Bundle Available for all ~134 Lessons too... and much cheaper to purchase them all.1) Lecture Notes w/Examples2) Worksheet to practice3) KEY for Worksheet with full solutions, step-by-stepWhat does Lesson 126 cover? In this lesson, we will learn about Frequency and Frequency Tables. We will also learn about Histograms, how to set them up, and analyze them. To connect, follow me on Instagra
Subjects:
Grades:
7th - 9th
Types:
Also included in: Algebra 1 - COMPLETE 134 Lessons - Covers ALL Topics - BUNDLE!!
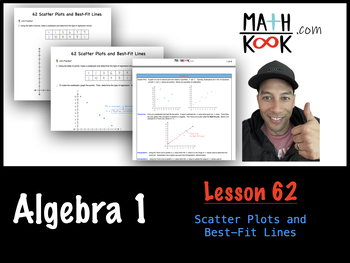
Algebra 1 - Scatter Plots and Best-Fit Lines (62)
This is 62 of ~134 Algebra 1 Lectures available. Each Lesson consists of the following 3 items. Bundle Available for all ~134 Lessons too... and much cheaper to purchase them all.1) Lecture Notes w/Examples2) Worksheet to practice3) KEY for Worksheet with full solutions, step-by-stepWhat does Lesson 62 cover? In this lesson, we will learn how to draw and analyze a scatterplot. We will also learn how to find a best-fit line of a set of points using with algebra and by using a TI-84 Calcul
Subjects:
Grades:
7th - 9th
Types:
Also included in: Algebra 1 - Linear Equations - BUNDLE!!
Data Representation Powerpoint
The presentation contains: 1) TALLY MARKS Learning Objectives. Definition of a tally mark. Uses of tally mark. How to count a tally mark. Tally Mark Chart. Construction of a tally mark table with an example. Application on real life problems on tally mark. Read and Interpret a tally mark table.The presentation contains: 2) FREQUENCY DISTRIBUTION TABLEDefinition of a Frequency Distribution Table. Types of Frequency Distribution Table: a) Discrete Frequency Distribution Table (Ungrouped).b) C
Subjects:
Grades:
1st - 10th, Higher Education, Staff
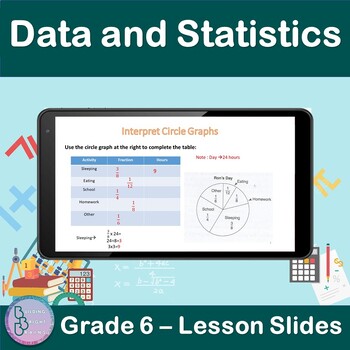
Data and Statistics | 6th Grade PowerPoint Lesson Slides | Circle Graphs
Are you teaching your students about Data and Statistics For 6th Grade? Plenty of examples and application exercises are included. You can also easily convert this to a Google Slides lesson by dragging it into your Google Drive.What is included?✦ 9 total slides for notes, examples and applications.✦ All steps are animated to allow the teacher to explain them gradually. At the end of the lesson, students will be able to✦ Interpret Circle Graphs.✦ Use a circle graph to complete s table.✦ Use a cir
Subjects:
Grades:
5th - 7th
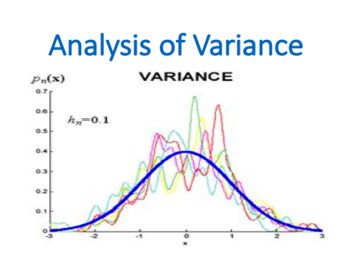
Analysis of Variance (ANOVA) (Statistics)
Analysis of Variance (ANOVA) is a lecture which is covered within the Statistic or Basic Business Statistic module by business and economics students.Analysis of variance, known by the acronym ANOVA, allows statistical comparison among samples taken from many populations. While ANOVA literally does analyze variation, the purpose of ANOVA is to reach conclusions about possible differences among the means of each group, analogous to the hypothesis tests of the previous chapter. Every ANOVA design
Subjects:
Grades:
5th - 12th, Higher Education, Adult Education, Staff
Types:
Also included in: Statistics Module Bundle
A Roadmap for Analyzing Data (Statistics)
A Roadmap for Analyzing Data is a lecture which is covered within the Statistic or Basic Business Statistic module by business and economics students. Choosing appropriate statistical methods for your data is the single most important task you face and is at the heart of “doing statistics.” But this selection process is also the single most difficult thing you do when applying statistics! How, then, can you ensure that you have made an appropriate choice? By asking a series of questions, you can
Subjects:
Grades:
5th - 12th, Higher Education, Adult Education, Staff
Also included in: Statistics Module Bundle
Graphing & Statistics for Biology Google Slides Lesson
Features a Google Slides lesson/presentation that reviews how to make scientific data tables, graph scientific data, and calculate mean, median, mode, and range.The topics covered in this presentation include:Identifying types of DataConstructing Data TablesCalculating Mean, Median, Mode, Range & Standard DeviationPlotting a GraphInterpolation & Extrapolation of DataKeep your students engaged and accountable with this interactive, versatile presentation. Embedded within these 27 colorful
Subjects:
Grades:
6th - 12th
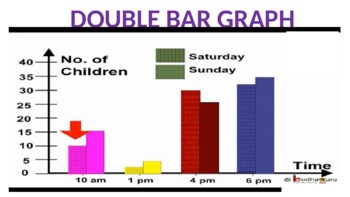
Double Bar Graph Powerpoint
The presentation contains:Learning Objectives.Definition of a double bar graph.Parts of a double bar graph.Difference between bar graph and double bar graph.Tips for construction of double bar graph.Steps to construct double bar graph with an example.To read and interpret the double bar graph.
Subjects:
Grades:
5th - 10th, Staff
Also included in: Data Representation Powerpoint
Intro to Statistics
This presentation covers applications of statistics, measures of central tendency (mean, median mode), quartiles, measures of dispersion (range, standard deviation), outliers, percentiles, intro the to Central Limit Theorem, the normal distribution, (bell-shaped curves), sample vs. population.Slides are animated and will walk through solving problems.Best taught over 2-3 lessons.
Subjects:
Grades:
7th - 12th, Higher Education, Adult Education
Showing 1-24 of 86 results


