652 results
6th grade graphing projects
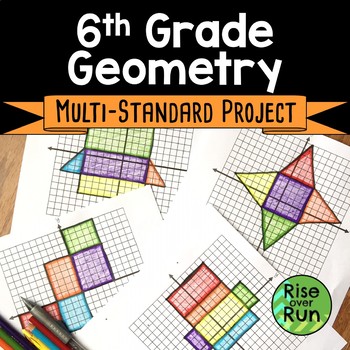
6th Grade Math Geometry Project for End of the Year with Nets and Surface Area
With this project, students must identify nets and 3D figures along with calculating surface area, perimeters, and volume. It is great way to practice several sixth grade standards! Students get hands-on experience working with nets, surface area, and volume. Not only is this activity engaging, but it will help create a conceptual understanding of 3D figures and their attributes. The project has 4 parts and 2 Follow Up practice worksheets. The parts can be assigned to individual students or par
Grades:
6th
Types:
Also included in: 6th Grade Math Activities Bundle
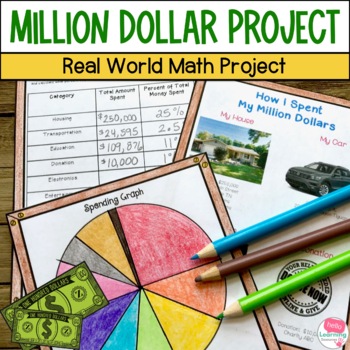
Million Dollar Project - Real World Math Project for Decimals and Money 4th 5th
This million dollar project gives your students a real world math project apply what they have learned about decimals, money, graphing, and percents. This makes a great financial literacy project to help kids understand costs, spending, and where money goes.Open the PREVIEW to see details of what is included.This resource includes:Teacher information and ideas for helpful websites for gathering informationStudent recording sheet for tracking spendingStudent sheet for calculating percentage of mo
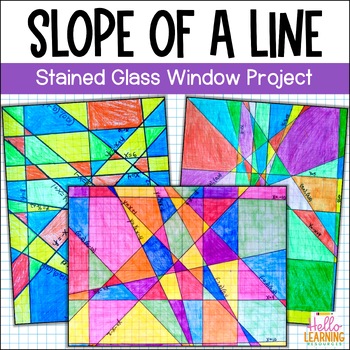
Slope Intercept Form Activity - Stained Glass Slope Project - Coloring Activity
Students will show what they know about slope intercept form, linear equations, and x and y intercepts in this fun and creative stained glass slope project! Perfect to use as an activity or assessment while teaching slope. Great integration of math and art!⭐ This resource includes:teacher activity directionsstudent directions3 linear equation worksheet pages for students to complete that determine the lines they will graphphotos of finished projectssample solution gradin
Subjects:
Grades:
6th - 7th
Types:
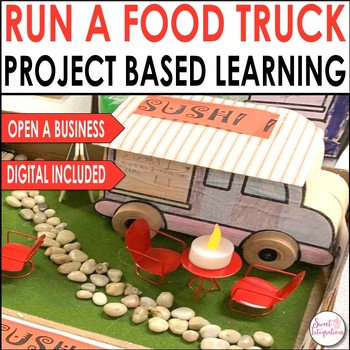
Design and Run a Food Truck STEM With Digital PBL - Project Based Learning Math
Introduce your students to the FOOD TRUCK CRAZE as they master their math and STEM skills through this project based learning math unit. With this math project based learning unit, students will design and run their own food truck! As they plan their final product in this PBL unit, students integrate digital learning by investigating various cultures and diversity and learning about foods from different countries. They will be able to represent a country of their choice, design (STEM) open a fo
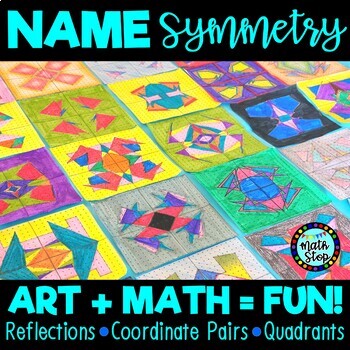
Math Art Activity Name Symmetry | Transformations Reflections Quadrants
A great personalized activity to incorporate art and math. Help your students develop their knowledge of graphing coordinate pairs, quadrants, and reflections about the x and y-axis with this fun and engaging art activity. Great for a geometry lesson plan that is looking to help solidify an understanding of quadrants, symmetry, transformations (reflections), with a cool symmetrical drawing as a finished product. Students personalize their experience by using the letters of their name to decode
Grades:
6th - 10th
Types:
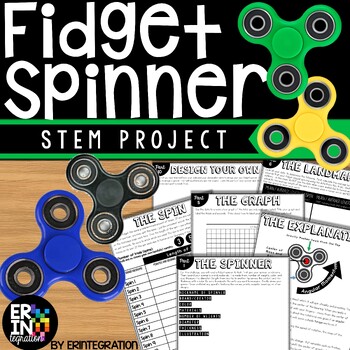
Fidget Spinner STEM Challenge Activities and Science Experiment
The ORIGINAL Fidget Spinner Stem Challenge & Science Lab! Discover the science of fidget spinners with this engaging and low-prep STEM activity. Practice scientific method with an exploration of variables, data collection, graphing, mean/average, and more...all while having fun!This self-paced, fidget spinner activity is print-and-go. Each activity sheet guides students through the project. STEM Challenge Overview:Students will use the included visual directions, graphic organizers, chart
Subjects:
Grades:
3rd - 6th
Types:
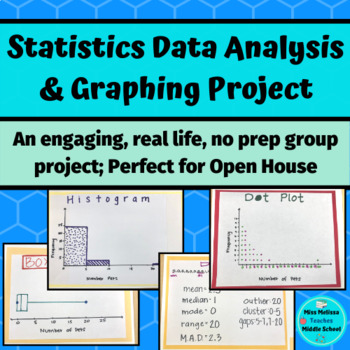
Statistics Project: Data Analysis & Graphing- real life, no prep
This statistics project is intended as a closure for your sixth grade statistics unit and aligns with ALL of the sixth grade statistics and probability common core state standards. In groups, students work together to choose a statistical question to ask the class. Once the class is surveyed, the group works together to create a frequency table, a dot plot, a histogram, and a box and whiskers plot. After creating their graphs, the groups analyze their data by looking at the mean, median, mode ra
Subjects:
Grades:
6th - 7th
Types:
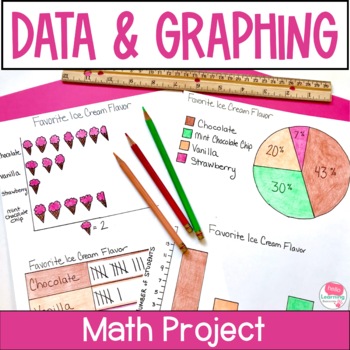
Data and Graphing Project - Real World Math Project Based Learning Activities
This data and graphing project gives your students a meaningful way to apply their data and graphing skills. Use this real world math project as an end of unit activity, enrichment activity or assessment. Easy to use and fun for students!Click the PREVIEW button above to see everything that is included in this fun math project!⭐ This resource includes:teacher information, directions and sample schedulesupply listgrading rubricstudent direction sheettwo data collection sheets (one for open ended
Subjects:
Grades:
4th - 6th
Types:
CCSS:
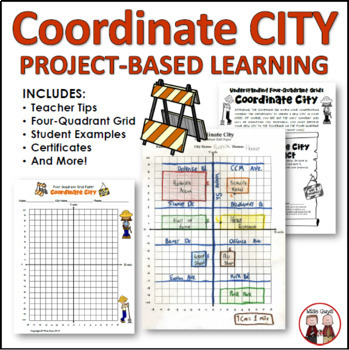
End of Year Math Coordinates City Project
Are you looking for an engaging end of year activity to teach coordinates to your upper elementary and middle school math students? Your upper elementary and middle school students will become engaged as they are asked to design a city based on using a coordinate plane. This is a teacher-friendly resource and minimal prep is involved.This resource contains 9 total documents (12 pages total) that are intended to be a creative math lesson plan that has students create their own city using coordina
Subjects:
Grades:
4th - 6th
Types:
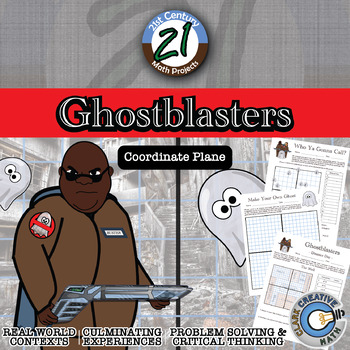
Ghostblasters -- Ordered Pair & Coordinate Plane - 21st Century Math Project
There’s something strange in your neighborhood! Ghosts have managed to escape the capture chamber and have wreaked havoc all over the region. On the case in this 21st Century Math Project is an upstart ghost catching team, the Ghostblasters. Given the ordered pairs on the Ghostblasters radar, find which buildings are infested with ghosts.Blend ordered pair and coordinate plane practice with fun for all!In this 20 page document you will be given a mapping to the Content Standards, an outline for
Grades:
5th - 12th
Types:
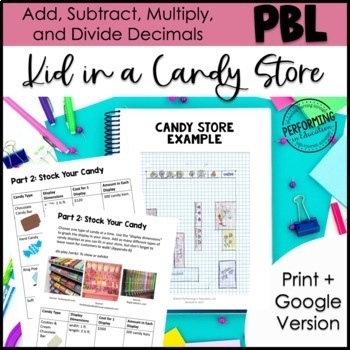
Add, Subtract, Multiply Decimals Project Based Learning | Valentine's Day
Looking for an exciting and engaging way to teach your 5th graders about adding, subtracting, and multiplying decimals? Look no further than our "Adding, Subtracting, Multiplying Decimals Project Based Learning for 5th" math project! This is a great PBL for Valentine's Day or any other day of the year with the engaging candy shop theme.This week-long math project is designed to help students develop a deep understanding of these key mathematical concepts through hands-on activities that challeng
Subjects:
Grades:
4th - 6th
Also included in: 5th Project Based Learning Math Starter Kit Bundle
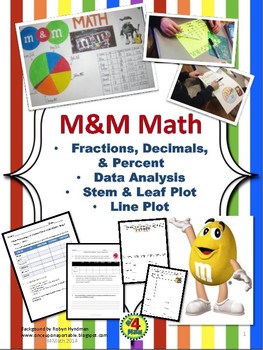
M&M Math: Fractions, Decimals, Percents, Graphs, & Data Analysis
These 3 sweet-filled activities and student project centered on data from bags of Fun-Sized M&Ms are a hit with my 5th graders! Students find the fraction, decimal, and percent of each color in their M&Ms bag and create a project displaying their data on a table and a circle graph. Students share their percentages with the class and work in groups to analyze the data. Line Plots are created from the number of M&Ms in their bags and Stem & Leaf Plots are created from the percents
Subjects:
Grades:
4th - 7th
Types:
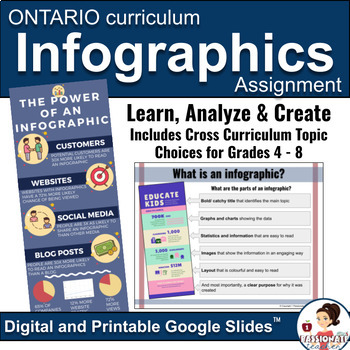
Infographics | New Ontario Math Curriculum 2020 | Digital Lesson and Assignment
Teach your students about the power of using infographics in data management to tell a story about any topic. This lesson, practice and creation activity is as flexible as you need it to be right now. Includes rubrics and multiple curriculum topic suggestions for grades 4, 5, 6, 7 and 8 from Ontario curriculum expectations, including the New Ontario Math Curriculum 2020 and can be used for virtual or in-person learning. And like with all of my products, this resource is completely editable! Perf
Subjects:
Grades:
4th - 8th
Types:
Lucky Charms Cereal Data Analysis and Graphing Project St. Patrick's Day
Looking for a way to review data analysis and graphing skills without it being a bore? This Lucky Charms Cereal Data Analysis and Graphing Project is a fun activity to incorporate in March for St. Patrick's Day, but of course it works at any time of the year in a graphing unit or in a math-integrated unit. Your students will smile when you whip out the box of Lucky Charms and tell them that they are to pretend they are the Quality Control Department at the Cereal Company! This activity is fun an
Subjects:
Grades:
6th - 8th
Types:
NGSS:
MS-ETS1-4
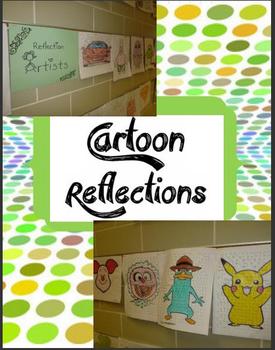
Reflection & Line of Symmetry Cartoon Artists
Students get tired of the typical "reflect the single point over the line," "reflect the triangle over the x-axis," and "draw the other half of the butterfly." By 5th grade, the students have probably seen the "reflection" lesson at least 3 times! This lesson is a little more advanced and involves a little more thought and just might excite your students!!! (I know my kids LOVE lots of choices and using art in math)This packet includes:-cover page-Step by Step instructions for how to reflect ove
Subjects:
Grades:
5th - 10th
Types:
CCSS:
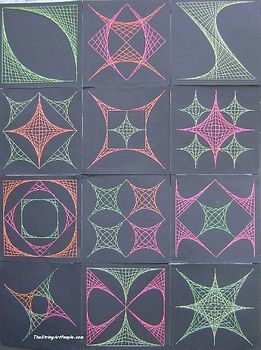
Coordinate Plane Graphing -- 15 String Art Designs for 4 Quadrant Squares
Supply your own needles and thread and follow directions given as 4 quadrant coordinates to sew 15 different designs. Can be used in connection with lessons (not included) on graphing, slopes, parabolic curves, etc. Revised pre-sewing worksheets included.
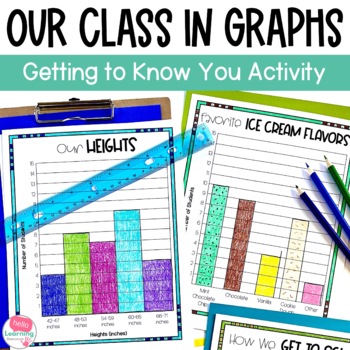
Back to School Graphing Get to Know You Math- Data and Graphing Project
This back to school graphing and data project is a low prep, high engagement way for students to conduct data collection about their classmates and make different types of graphs. Use these graphs for graphing practice, assessments, graph of the week or math centers.Click the PREVIEW button to see what is included.What's Included:Teacher directions, information and ideasGraph discussion question promptsBulletin board exampleGraph of the day or graph of the week exampleCollecting data sheets (4 o
Subjects:
Grades:
4th - 6th
Types:
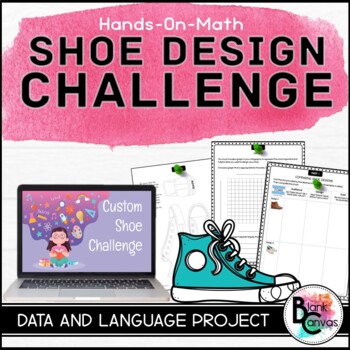
Shoe Design Challenge - A Data Management Project
Engage your students in data management with this fun and engaging cross-curricular shoe design challenge. This project based learning experience will have students collect data and analyze it to help design a shoe for a target audience. Once students have created their design, they will create an infographic about their shoe and persuade their audience on selecting the shoe. This organized 5-step process will be sure to encourage creativity. This project is versatile so you can adapt it to vari
Subjects:
Grades:
3rd - 8th
Types:
Dilations Initials Project - Project Based Learning with Digital Easel Activity
Dilations Initials Project.This is a culminating project for a unit on dilations. Students enlarge and shrink a drawing of their initials on grid paper or poster-board and use coordinate graphing rules to produce a similar image. In addition, they enlarge the image and it must have a scale factor of at least 4. Then they shrink the image and it must have a scale factor of at most 1/4. Good activity for project-based learning. Digital and Print: Includes an Easel Activity ready for learning with
Subjects:
Grades:
6th - 9th
Types:
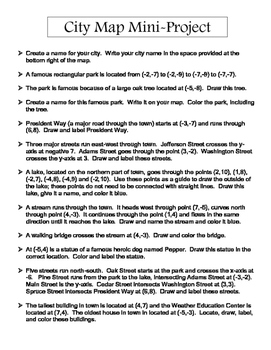
City Map Project (Integers and Coordinate Graphing Project)
Students use their knowledge of the coordinate grid and following directions to create a map of a small city. Once complete, students answer questions to apply concepts of 6th Grade Integers and Coordinate Graphing. Their is also an optional small writing project (less than 100 words) for students to practice creative writing.
Subjects:
Grades:
6th
Types:
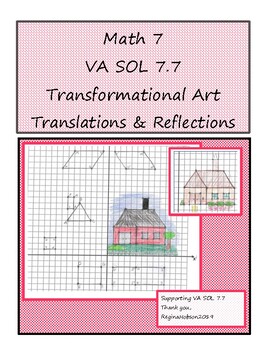
Virginia VA SOL 7.7 Transformation Art Project: Translations and Reflections
This PBA (Performance Based Assessment) supports VA SOL 7.7. Students will perform translations and/or reflections of quadrilaterals or triangles to create a simple "self checking" picture. The project is designed to use at the end of a my Unit 9 on Transformations as review before the unit test. My students love to draw, so anytime I can incorporate drawing into my lessons, they really perform well. I could hear a pin drop during this activity and the end results produced a really cute bull
Grades:
6th - 8th
Types:
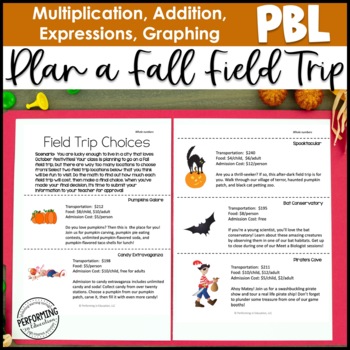
Math Project Multiplication, Addition, Expressions, Graphing | Fall Activities
Math Project-based learning (PBL) for Halloween, Fall, or October. Help your students practice decimals, expressions, and graphing with this quality project-based learning for grades 4 and 5. It includes a teacher guide walking you through each step.Are your students excited about October? Mine absolutely love pumpkins, bats, and everything Halloween! This is a great activity to get students excited about Math! Project-Based Learning incorporates in-depth inquiring, voice, and choice. Students w
Subjects:
Grades:
5th - 6th
Types:
Also included in: 5th Grade Math Project Based Learning Bundle
Statistics Project - Middle School Math 6.SP
I designed this project to use a major grade instead of a test. This can be done individually, or in groups. I have included the data cards that I handed out to my groups, but feel free to have them gather their own data, or make up your own. The purpose of this project was to analyze the students’ abilities to create a box plot, a histogram, and a stem and leaf plot. They will have to figure out on their own that those are the three displays that will best fit the data I gave them.
This is al
Subjects:
Grades:
6th - 8th
Types:
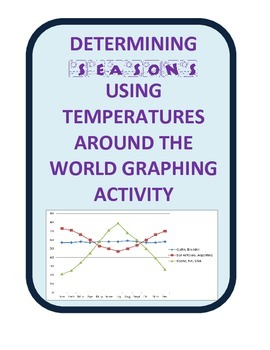
Graph World Temperatures to Understand Seasons and Earth's Tilt
Students analyze temperature data to discover the pattern of temperature change from the summer to winter in the Northern and Southern Hemispheres and the Equator. Students first find locations using longitude ad latitude, then graph temperatures to show seasonal differences around the world. Students then answer questions and look at a diagram of the earth's tilt to understand seasons.
FUN- and VERY ENGAGING! Helps students 'get it'!
Seasons Labs and Station Science!
Understanding Seasons
Subjects:
Grades:
5th - 9th
Types:
Showing 1-24 of 652 results


