733 results
6th grade graphing interactive notebooks
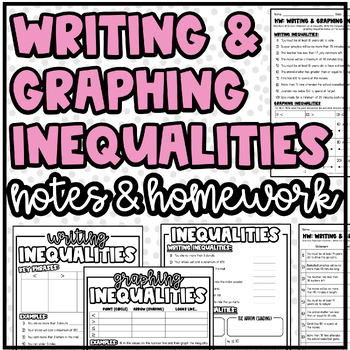
Writing & Graphing Inequalities | Notes & Homework or Practice
Writing & Graphing Inequalities Notes & Homework:This resource includes notes pages and homework/practice that goes along with the notes! It's organized, clean, and ready to go! All you need to do is print! :) Make sure you check the previews for a visual! Includes:Notes: Writing InequalitiesNotes: Graphing InequalitiesNotes: Writing & Graphing Inequalities (this is a combined notes page of the two above - same problems - just merged onto one page)Homework: Writing & Graphing Ine
Grades:
5th - 7th
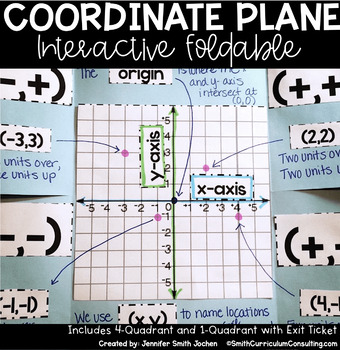
Coordinate Plane Four Quadrant and One Quadrant Flippables
Identifying Ordered Pairs within a Four Quadrant Graph, or a One Quadrant Coordinate Plane, are one of the most fun skills for students! This 4-Flap Interactive Foldable is perfect for students to identify the origin, x-axis, y-axis and coordinate pairs and the mini book allows students to identify the origin, x-axis, y-axis, and positive coordinate pairs.The Ordered Pairs Interactive Foldables are a set of unique reference tools that I have been using in my classroom as a part of our Interactiv
Grades:
4th - 6th
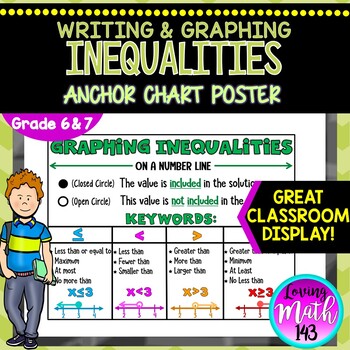
Writing and Graphing Inequalities on a Number Line Anchor Chart Poster
This middle school math anchor chart includes important key words to determine if an inequality should be: greater than or equal to, less than or equal to, greater than, or less than. If the inequality symbol is "greater than" or "less than" then the graph will be an open circle. If the inequality symbol is "greater than or equal to" or "less than or equal to" then the graph will be a closed circle. Students will see important key words, number lines, and examples! This anchor chart poster is a
Grades:
6th - 7th
Also included in: 6th Grade Math Anchor Posters for the whole Year! {BUNDLE!}
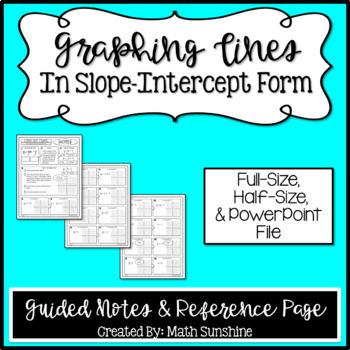
Graphing Linear Equations in Slope-Intercept Form Guided Notes & Reference Page
Graphing Linear Equations in Slope-Intercept Form Guided Notes and Reference Page:These Guided Notes and this “Reference Page” will help your students learn how to graph lines on the x-y coordinate plane. Use the Guided Notes to teach the concept or use the Reference Page to provide your students with lots of examples that have already been worked out. The Reference Page is particularly helpful for Geometry and Algebra 2 students who just need to refresh their memory on this topic. The Guided No
Grades:
6th - 12th
Types:
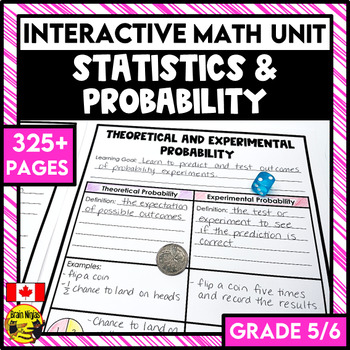
Statistics Graphing and Probability Interactive Math Unit | Grade 5 and Grade 6
Stop searching for your statistics and probability lessons. Everything you need to teach, practice, and assess double bar graphs, line graphs, stem and leaf plots, and probability is included in this print-and-use unit. Your planning for your graphing and probability unit is already done for you!This unit is part of the Full Year Interactive Math Unit Bundle for Grade 5/6. It comes with a bonus sequencing guide to help plan your whole year.This all-inclusive resource includes:instructions for ho
Subjects:
Grades:
5th - 6th
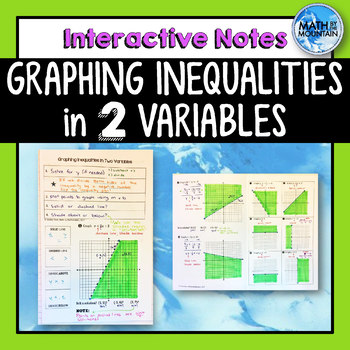
Graphing Linear Inequalities in 2 Variables Interactive Notebook Notes
These notes are perfect for an interactive notebook (INB) and are built to reinforce prior concepts. Help your students see the process graphing inequalities in two variables on the coordinate plane. Explore the special cases of vertical and horizontal inequalities! In some examples, students must solve for y prior to graphing, which is a fantastic review of (1) rerwriting equations, (2) remembering the flip the sign, and (3) identifying slope and y-intercept! The front page of these notes are
Subjects:
Grades:
6th - 10th
CCSS:
Also included in: Unit 7 - Systems of Equations & Inequalities - Interactive Notebook Kit
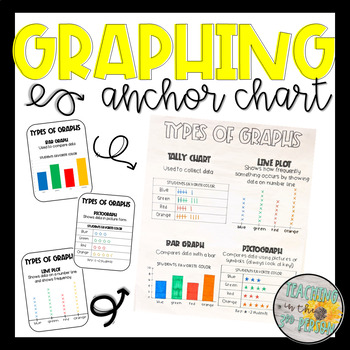
Types of Graphs Anchor Chart - Tally Chart, Bar Graph, Pictograph, Line Plot
Graphing made easy!Use these templates as a guide in creating your own anchor charts or print and use them in other helpful ways:Trace and create an anchor chart with studentsPrint on bright colored paper and use as postersShrink down and glue in student' math notebooks for a reference sheetPrint and send home as reference tools for students and parents (homework or tutoring)Earn Credit for Future Purchases:I appreciate each & every word of your valuable feedback. Also, if you leave feedback
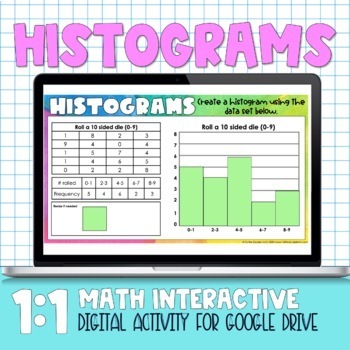
Histograms Digital Practice Activity
Histograms Digital Practice ActivityThis product is a Google Slides product- students can complete it digitally. Included in this product: -4 different histogram problems- students have to drag and drop to create histogram plots-4 page printable version-Answer KeysCheck out my other Distance Learning Digital Products Here
Subjects:
Grades:
6th - 7th
Also included in: Statistics Digital Activities
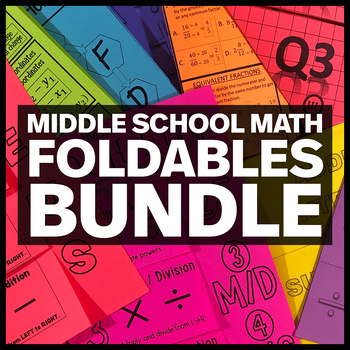
Middle School Math Foldables Bundle - Interactive Math Notebook Inserts
Try some foldables in your interactive math notebook to mix things up. Students will enjoy taking the notes and referring back to them later.Foldables Included:Converting between Percentages, Decimals and Fractions FoldableConverting between Percentages, Decimals and Fractions Foldable (Different)Coordinate Plane FoldableDivisibility Rules FoldableFraction Operations FoldableFractions Foldable (All things fractions, including fraction operations)Greatest Common Factor FoldableInteger Rules Fold
Subjects:
Grades:
6th - 8th
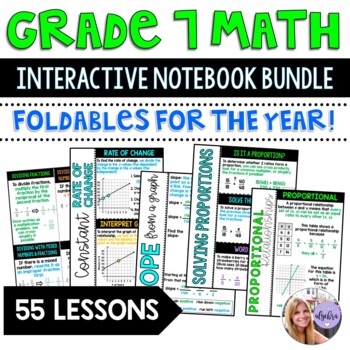
Grade 7 - Interactive Math Notebook Bundle - Entire Year
This is a bundle of foldables and flipbooks designed for an interactive math notebook!Once it is purchased, all buyers will receive updates to this bundle for free as they are added!This bundle includes resources for the skills:Chapter 1: Ratios and Proportional ReasoningUnit Rates and PricesWriting and Simplifying RatiosEquivalent RatiosProportional RelationshipsSolving ProportionsConstant Rate of ChangeFinding Slope from a GraphConstant of ProportionalityChapter 2: PercentsPart, Whole, and P
Subjects:
Grades:
6th - 8th
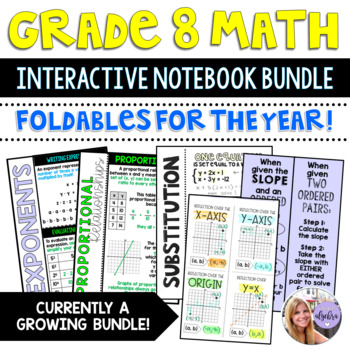
Grade 8 Interactive Notebook Growing Bundle - Foldables & Flipbooks for the Year
This is a growing bundle of grade 8 math resources designed for an interactive math notebook. Because a lot of the grade 8 content is introduced in early grades (and is the introduction to upper levels such as Algebra 1 and Geometry), you will see a lot of topics marked for different grade levels.This growing bundle will include all of the topics covered in Grade 8. As this bundle grows, the price will increase. Once purchased, the buyer will receive all additional updates and resources for f
Grades:
6th - 9th
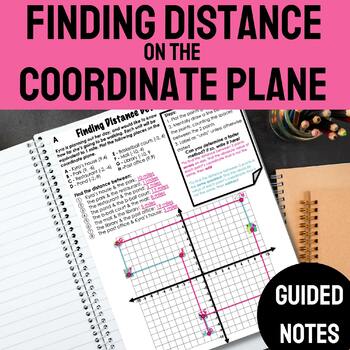
Finding Distance Between 2 Points on the Coordinate Plane Notes EDITABLE
These are EDITABLE note sheets to guide students through finding the distance between two points (2 vertical points or 2 horizontal points) on the coordinate plane! Students plot the 8 given points to represent 8 different places in a town. Then, students find the distances between the places in the town. There is a step-by-step guide for students to reference on the note sheet. The ordered pairs between the two points on the coordinate grid either share the same x-coordinate or y-coordinate of
Grades:
6th - 7th
Also included in: Coordinate Plane Notes and Practice Worksheets Bundle EDITABLE
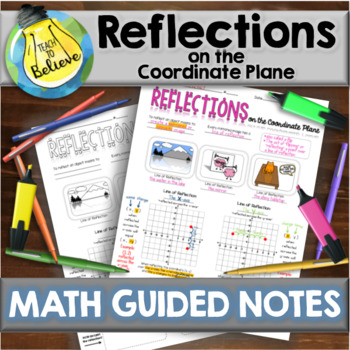
Reflections on the Coordinate Plane - Guided Notes
Reflections on the Coordinate Plane - Guided Notes These notes explain to your students how to reflect a point across an axis. What is Covered:-Explanation of "Line of Reflection"-Explanation of Reflecting Across an Axis-ExamplesWhat's Included:-Blank Student Copy-Typed Colorful Key-Completed Student SampleHow to Use This Product:After students have completed these guided notes, it is best for them to keep them in sheet protectors in a math folder. You can download a FREE blank table of contents
Grades:
6th
CCSS:
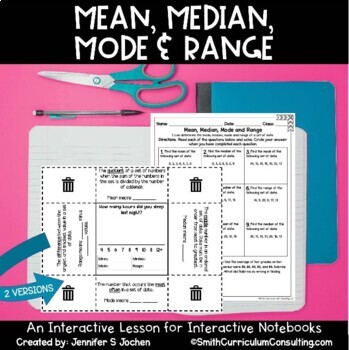
Mean, Median, Mode and Range Foldable Interactive Notebook Lesson with Practice
Ready to review the basics of Mean, Median, Mode and Range? This flippable has all that you need for your students to have a resource for the definition, a keyword to help them remember, as well as a graph to compile data from the class and determine the Mean, Median, Mode, and Range for your class data!Includes:Teacher Directions with a full-color photoMean, Median, Mode, and Range Foldable (2 versions)Mean, Median, Mode, and Range Practice SheetMean, Median, Mode, and Range Practice Sheet Answ
Subjects:
Grades:
5th - 7th
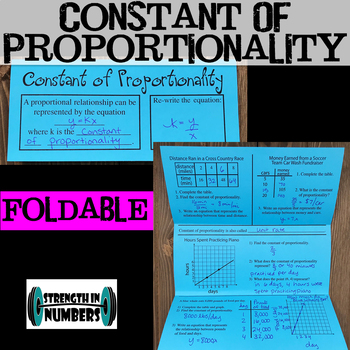
Constant of Proportionality Foldable Notes Interactive Notebook
Students love foldables for notes! This one covers constant of proportionality from an equation, line or table. These go perfectly with the 7th grade standards for proportional relationships and unit rate. This uses a couple of examples from my constant rate of change foldable. Our new curriculum (Carnegie Learning) really stresses constant of proportionality taught this way so I made a new foldable for myself this year. Fits perfectly in a composition book for interactive notebooks or can b
Subjects:
Grades:
6th - 8th
Also included in: Complete BUNDLE of 50 Foldable Notes for Math 7
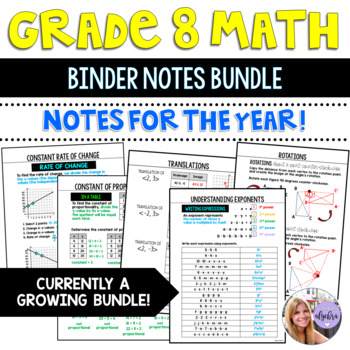
Grade 8 Binder Notes Worksheets Growing Bundle - Entire Year
This is a growing bundle of grade 8 math resources designed for printing and hole-punching for a math binder. Because a lot of the grade 8 content is introduced in early grades (and is the introduction to upper levels such as Algebra 1 and Geometry), you will see a lot of topics marked for different grade levels.This growing bundle will include all of the topics covered in Grade 8. As this bundle grows, the price will increase. Once purchased, the buyer will receive all additional updates and
Grades:
6th - 9th
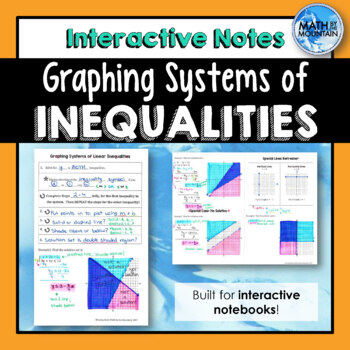
Solving Systems of Inequalities by Graphing Interactive Notebook Notes
This set of solving systems of inequalities by graphing problems comes complete with 4 examples, plus a refresher on how to graph vertical and horizontal lines! These notes are perfect for an interactive notebook (INB) and are built to reinforce prior concepts. Help your students see the process behind solving a system of linear inequalities. Explore the special case of having no solution as well as graphing with horizontal and vertical lines.All examples have been thoughtfully chosen to generat
Subjects:
Grades:
6th - 12th
CCSS:
Also included in: Unit 7 - Systems of Equations & Inequalities - Interactive Notebook Kit
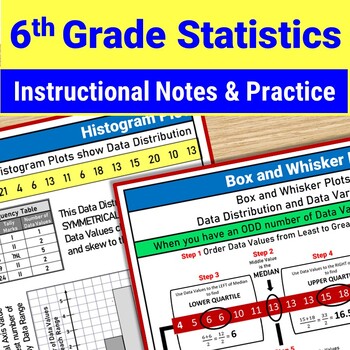
6th Grade Statistics Project Box Plot Mean Median Mode Range Histogram Activity
Teach all 6th Grade Statistics and Probability Standards with this 10-day Instructional Notes and Practice Unit. Calculate Measures of Central Tendency (mean, median, mode, range) and Mean Absolute Deviation. Master Data Display with Box and Whisker Plots, Histograms, Dot Plots, Stem and Leaf Charts. Write Statistical Questions. Analyze Data Distribution and Data Variability. No need to dread teaching 6th Grade Statistics because your textbook does a mediocre job of explaining how to calculate a
Subjects:
Grades:
6th - 8th
NGSS:
MS-ETS1-2
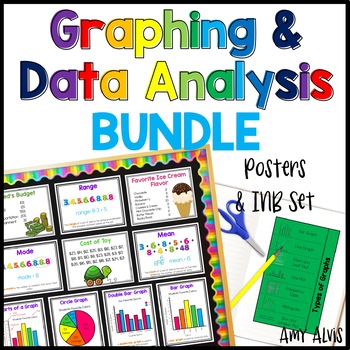
Graphing and Data Analysis Bundle Posters Interactive Notebook INB Anchor Chart
This bundle includes my Graphing Poster and Interactive Notebook (INB) set, my Data Analysis Poster and Interactive Notebook (INB) set and my Data Posters and Cards. Make sure to check the links below to see what comes with each set.This bundle includes:1. My best selling Graphing - Poster and INB Set.This poster and interactive notebook (INB) set includes FOURTEEN posters covering bar graphs, double bar graph, pictographs, picture graph, line graphs, double line graph, line plot, circle graphs
Subjects:
Grades:
2nd - 6th
Analyzing Data BUNDLE: A Scientific Method Resource
This bundle contains resources to introduce, practice, and assess the analyzing data step of the scientific method in your middle school science classroom. Two interactive notebook pages will introduce the purposes of bar graphs, line graphs, and pie charts and what makes a good graph. The editable 29 slide PowerPoint can be used to guide students during their notetaking in their INBs or can be used separately to review and practice the material covered in the notes. Two different worksheets wil
Subjects:
Grades:
5th - 8th
NGSS:
MS-ETS1-3
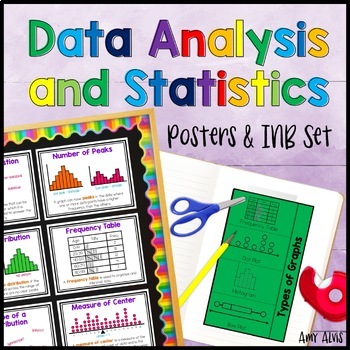
Data Analysis and Statistics Posters and Interactive Notebook INB Set
This poster (anchor chart) and interactive notebook (INB) set covers statistical questions, numerical data, categorical data, frequency table, dot plot, histogram, box and whisker plot, box plot, parts of a box and whisker plot, parts or a box plot, measure of center, spread, shape of distribution, symmetry, number of peaks, skewness, uniform distribution, outlier and gaps. The INB pages cover Types of Graphs, Statistical Questions and Patterns in Data.It includes 3 different interactive foldabl
Subjects:
Grades:
6th - 8th
Also included in: 6th Grade Posters and Interactive Notebook INB BUNDLE Anchor Chart
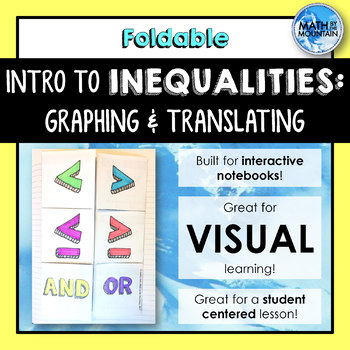
Intro to Inequalities - Graphing and Translating Foldable
This intro to inequalities foldable covers a brief introduction to graphing inequalities in one variable. Students learn whether to use an open or a closed point, and keywords that translate to the various inequalities. Each of the four inequality symbols are included, as well as compound "and" and "or" inequalities. Two different font options are included for the front flaps of the foldable. This foldable is perfect for a standalone lesson, review at the end of a unit, part of a stations act
Grades:
6th - 9th
CCSS:
Also included in: Unit 3 - Solving Multi-Step Inequalities - Interactive Notebook Kit
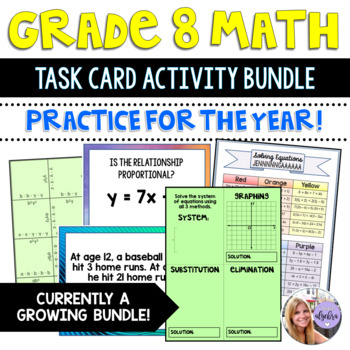
Grade 8 Math Activities: Task Cards, Puzzles, Games Growing Bundle - Entire Year
This is a growing bundle of grade 8 math resources designed for practicing skills! It includes puzzles, task cards, flash cards, Jenga, Bingo, and much more!Because a lot of the grade 8 content is introduced in early grades (and is the introduction to upper levels such as Algebra 1 and Geometry), you will see a lot of topics marked for different grade levels.This growing bundle will include all of the topics covered in Grade 8. As this bundle grows, the price will increase. Once purchased, th
Grades:
6th - 9th
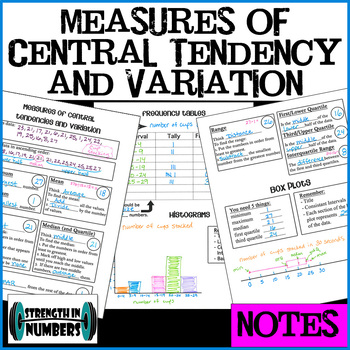
Interactive Notebook NOTES: Mean Median Mode Range Quartiles Box Plot Histogram
This set contains suggestions for student data collection and notes that use the data for measures of central tendencies and variation (mean, median, mode, range, first and third, quartiles, interquartile range, outliers), box plots, frequency tables, and histograms! Sounds like so much but these topics all go together so well. And by using data collected by students ABOUT students, they will be much more interested. This product contains ideas for collecting data, three full size (8.5x11) pa
Subjects:
Grades:
6th - 9th
Also included in: Complete BUNDLE of 50 Foldable Notes for Math 7
Showing 1-24 of 733 results


