32 results
6th grade statistics outlines
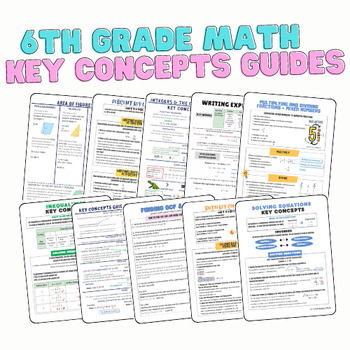
6th Grade Math: Key Concepts Guides/Anchor Charts BUNDLE
Give your students the KEY to success by purchasing this key concepts guides/anchor charts bundle. This bundle is a MUST HAVE resource for 6th grade classrooms and would also be a great one for 7th grade classrooms to have the important foundations to grow their knowledge! This bundle includes guides for ALMOST ALL 6th grade common core standards with just a few that are not addressed such as multiplying and dividing decimals using standard algorithm.Purchasing as a bundle saves you $7.50!The to
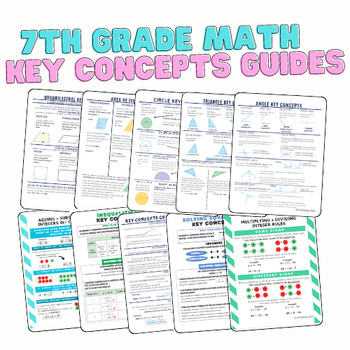
7th Grade Key Concepts Guides/Anchor Charts: BUNDLE
Give your students the KEY to success by purchasing this key concepts guides/anchor charts bundle. This bundle is a MUST HAVE resource for 7th grade classrooms and would also be a great one for 8th grade classrooms to have the important foundations to grow their knowledge!Purchasing as a bundle saves you $7.00!The topics included in this bundle are:1. Adding and Subtracting Integers2. Multiplying and Dividing Integers3. Solving and Writing Equations4. Solving and Graphing Inequalities5. Circles:
Subjects:
Grades:
6th - 8th
Types:
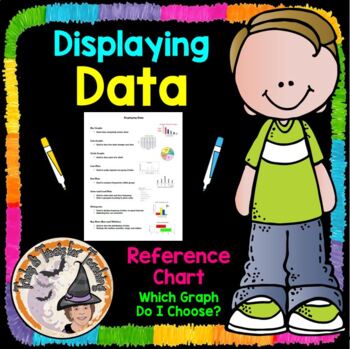
Displaying Data Reference Chart Notes Which Graph Do I Choose?
Math Teachers ~ You'll LOVE this Displaying-Data, Which-Graph-Do-I-Choose? Data-Display Reference-Chart will be SUPER helpful to your students in helping them determine which graph to choose, and provides a quick visual picture to remind them what that particular graph looks like. I printed one of these for each of my students to put inside their Math Toolkit Notebook, to use as a Reference for Data Displays Charts and Graphs. You'll enjoy using this year after year!Be sure to L@@K at my other 1
Subjects:
Grades:
5th - 8th
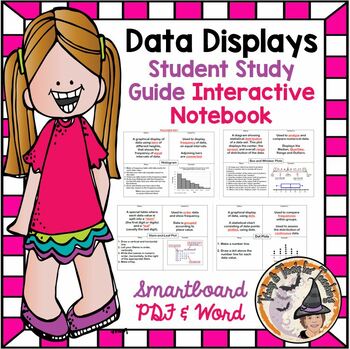
Data Displays Interactive Notes Stem Leaf Box Whiskers Histogram Dot Plots
Teachers ~ You'll LOVE these Interactive Notes that covers the following 4 data displays; Stem and Leaf Plot, Box and Whisker Plot, Histogram, and Dot Plot. The zipfile contains the Teacher's KEY version along with the Student's Fill in the Blank outline for Note Taking. You get BOTH the Students' Notes and the Teacher's KEY in both Word and Pdf formats for easy printing, along with Smartboard slides of everything as well. You'll LOVE using this year after year! Be sure to L@@K at my other 1,285
Subjects:
Grades:
5th - 7th, Staff
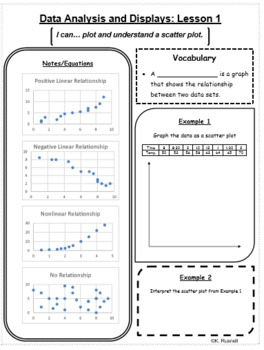
Data Analysis and Displays Notes
These guided notes are created to help differentiate and guide instruction for the math curriculum. This set of notes has been written based off of 8th grade standards and follows the Big Ideas Curriculum, but can be used for similar grades. Each page of notes includes an "I can" statement, vocabulary, student notes, step-by-step guides, examples, and story problems. Each notes is reduced to one page for quick reference. The vocabulary cards that go along with the vocabulary within the notes can
Subjects:
Grades:
6th - 10th
Types:
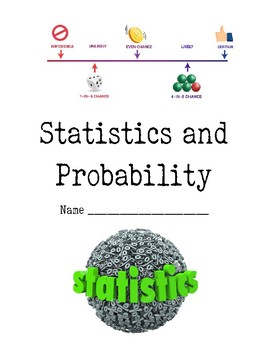
7th Grade Common Core Probability and Statistics Unit
Probability and Statistics Unit for 7th Grade Math Common Core
Lessons include:
Mean, Median, Mode, and Range
When to Use Each Measure
Mean Absolute Deviation - How to Calculate
Mean Absolute Deviation - Analysis
Sampling and Biased Surveys
Making Predictions from Survey Results
Simple Probability (Single Event)
Compound Probability - Independent Events
Compound Probability - Dependent Events
Subjects:
Grades:
6th - 8th
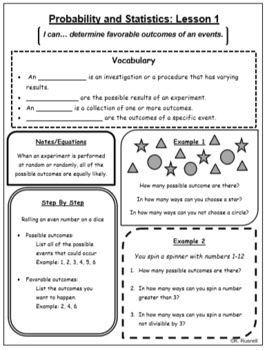
Probability and Statistics
These guided notes are created to help differentiate and guide instruction for the math curriculum. This set of notes has been written based off of 7th grade standards and follow the Big Ideas Curriculum, but can be used for similar grades. Each page of notes includes an "I can" statement, vocabulary, student notes, step-by-step guides, examples, and story problems. Each notes is reduced to one page for quick reference. The vocabulary cards that go along with the vocabulary within the notes can
Subjects:
Grades:
6th - 8th
Types:
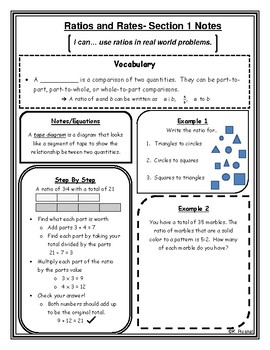
Ratios and Rates Notes
These guided notes are created to help differentiate and guide instruction for the math curriculum. This set of notes has been written based off of 6th grade standards, but can be used for similar grades. Each page of notes includes an "I can" statement, vocabulary, student notes, step-by-step guides, examples, and story problems. Each notes is reduced to one page for quick reference. The vocabulary cards that go along with the vocabulary within the notes can be found on my page as, "Math Vocabu
Subjects:
Grades:
5th - 8th
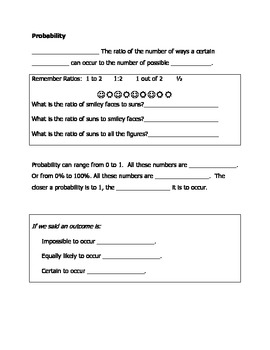
Interactive Notebook Probability Guided Notes: Theoretical vs Experimental
Guided notes discussing the concepts of Probability as a ratio, fraction, and percent. Further discussion compares Theoretical and Experimental Proability, the definitions, and forumulas to calculate. For 5th - 8th grade general education or special education classrooms. Great for your interactive notebooks.
Subjects:
Grades:
4th - 9th
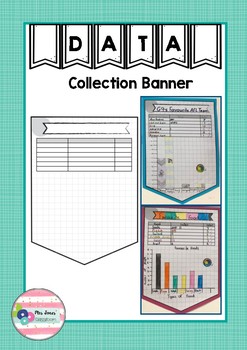
Data Collection Banner
Are your students collecting their own data and representing it using a graph this term? Then why not get them presented on this banner pendant and display them in your room.
Subjects:
Grades:
1st - 10th
Types:
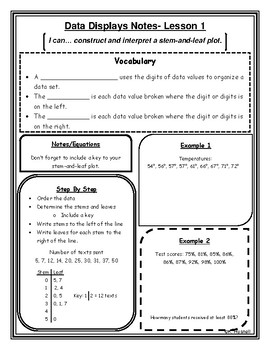
Data Displays Notes
These guided notes are created to help differentiate and guide instruction for the math curriculum. This set of notes has been written based off of 6th grade standards, but can be used for similar grades. Each page of notes includes an "I can" statement, vocabulary, student notes, step-by-step guides, examples, and story problems. Each notes is reduced to one page for quick reference. The vocabulary cards that go along with the vocabulary within the notes can be found on my page as, "Math Vocabu
Subjects:
Grades:
5th - 8th
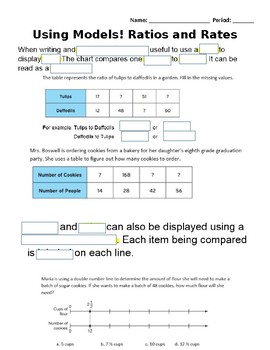
Using Models to Represent Ratios, Rates and Unit Rates Scaffold Notes
Students will use these fill in the blank notes to guide them through the Smartboard lesson on Models for ratios, rates and unit rates (located in store). Each page of the lesson is a screen shot with missing words. Students will fill in the blank and answer practice problems on handout. There is a lot an answer doc with the missing words filled in for any students with accommodations.
Subjects:
Grades:
5th - 7th
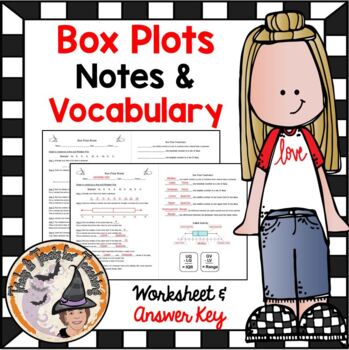
Box and Whisker Plots Notes and Practice Worksheet with Answer Key
Math Teachers ~ You'll love this AMAZING Box-and-Whisker-Plots-Notes-and-Practice, 2 page pdf where students take notes and practice creating and labeling a Box-Plot. The Zipfile contains the 2 page pdf printable worksheet and the 2 page Answer KEY. You'll LOVE using this year after year to introduce and practice Box Plots. This can be used as a Guided Practice, Math Station, Homework, or Independent Work. Answer KEY included. Learn to love teaching this skill with this terrific resource that st
Subjects:
Grades:
6th - 7th
Also included in: Box & Whisker Plots Smartboard Slides Notes Worksheet BUNDLE
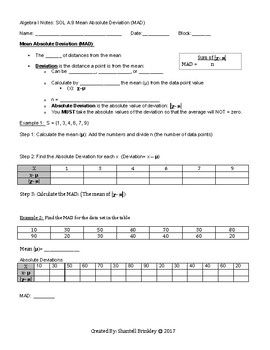
Mean Absolute Deviation (MAD) Notes
This 1 page cloze note sheet will guide students through understanding what the Mean Absolute Value is. Students will also have the opportunity to calculate the Mean Absolute Deviation for 2 sets of data points by hand. An answer key is also provided.
You are purchasing access for 1 teacher as a classroom set. The document is not to me shared with others or posted on any online venue at any time. For multiple teachers in a school please purchase the number of licenses required for a discounted
Subjects:
Grades:
6th - 12th, Higher Education, Adult Education
CCSS:
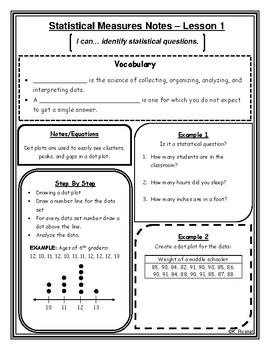
Statistical Measures Notes
These guided notes are created to help differentiate and guide instruction for the math curriculum. This set of notes has been written based off of 6th grade standards, but can be used for similar grades. Each page of notes includes an "I can" statement, vocabulary, student notes, step-by-step guides, examples, and story problems. Each notes is reduced to one page for quick reference. The vocabulary cards that go along with the vocabulary within the notes can be found on my page as, "Math Vocabu
Subjects:
Grades:
5th - 8th
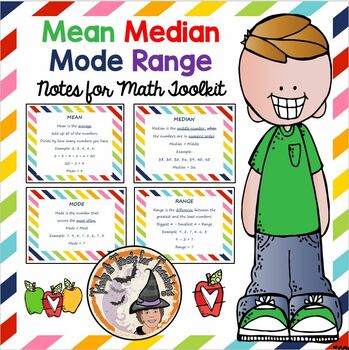
Mean Median Mode Range Notes Central Tendency Measures of Center
This Zipfile includes LOTS of goodies! You get a colorful background border notes for students for Measures of Center, Central Tendency; Mean-Median-Mode-and-Range, in 3 different sizes! The 3 pdf files are different sizes (full page sheets, half page sheets, and mini size 4 to a sheet). This allows for printing for students' Math Toolkits in whatever size you'd like. You also get a Smartboard slides of the 4 pages of colorful Notes, along with the original (4 pages) Word Document and PDF versio
Subjects:
Grades:
5th - 8th
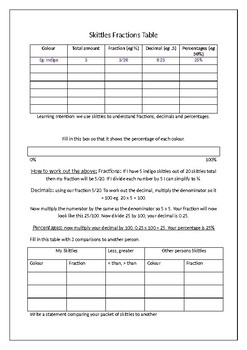
Skittles Fractions and decimals table
In this activity each of the students is given 20 skittles at random. They have to insert the amount and colours into their table. The object of the investigation is to then try and work out the fractions, decimals and percentages of each of their different colours of skittles.
Their are a series of questions and activities related to ratios of skittles to their fractions that the students can complete if they are at a higher level.
The students loved this activity especially when they found o
Subjects:
Grades:
3rd - 8th
Types:
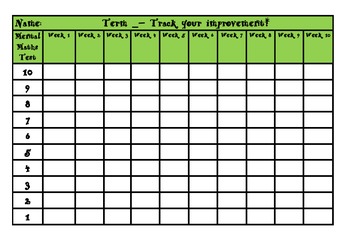
Track your improvement - mental maths graph!
Here is a printable that you can give to your students, which will help them to graph their weekly mental maths test results! Each set contains the most commonly sized mental maths tests - a graph for 10, 15, 20 and 30 questions. I have found that students achieve the best results when they can see themselves improving, and have to physically colour in a graph each week. They love trying to beat their score! This is great to put into their portfolio or take home folder so that parents (and stude
Subjects:
Grades:
2nd - 7th
Types:
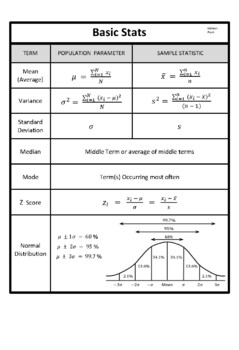
Basic Statistics (PDF)
Basic Statistics, Sample Statistics and Population Parameters, Mean, Median, Mode, Variance, Standard Deviation, Normal Curve.
Subjects:
Grades:
6th - 12th, Adult Education
Types:
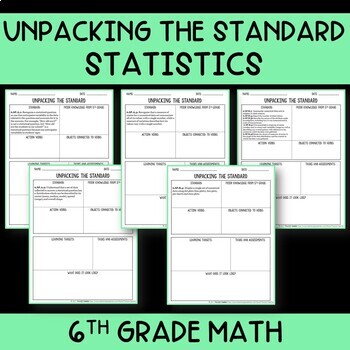
Unpacking the Standard - Statistics
Have you ever looked at a standard and wondered, “What is this? How am I going to teach it?” Have you ever had a student say, "What do all of these words mean in this standard? I don't know what its saying."? If so, this resource is for you!The work of learning and implementing new standards has to happen quickly. Implementing standards effectively requires teachers and students to dive deep into the standards to fully understand expectations and goals. Instead of saving the unpacking just for t
Subjects:
Grades:
6th
Types:
Also included in: 6th Grade Statistics Guided Notes Bundle + BONUS

Scaffolded Notes: Mean, Median, & Mode
These are scaffolded notes over mean, median, and mode. They contain definitions, examples, explanations, and pictures to provide a full picture of what each term means. I have my students paste these notes into their math journals. They reference them all the time when working out related problems! (PDF file).
Subjects:
Grades:
4th - 6th
Types:
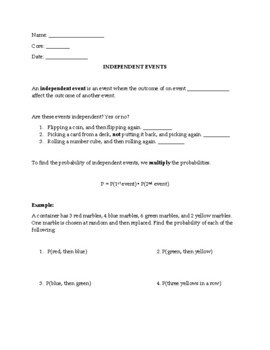
Probability of Independent and Dependent Events Notes
Fillable student notes and guided practice questions for Probability Independent and Dependent Events.
Subjects:
Grades:
6th - 8th
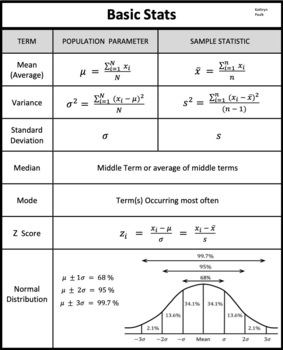
Basic Statistics (JPG)
Basic Statistics, Population and Sample Parameters, Mean, Median, Mode, Variance, Standard Deviation, Normal Distribution.
Subjects:
Grades:
6th - 12th, Adult Education
Types:
Showing 1-24 of 32 results


